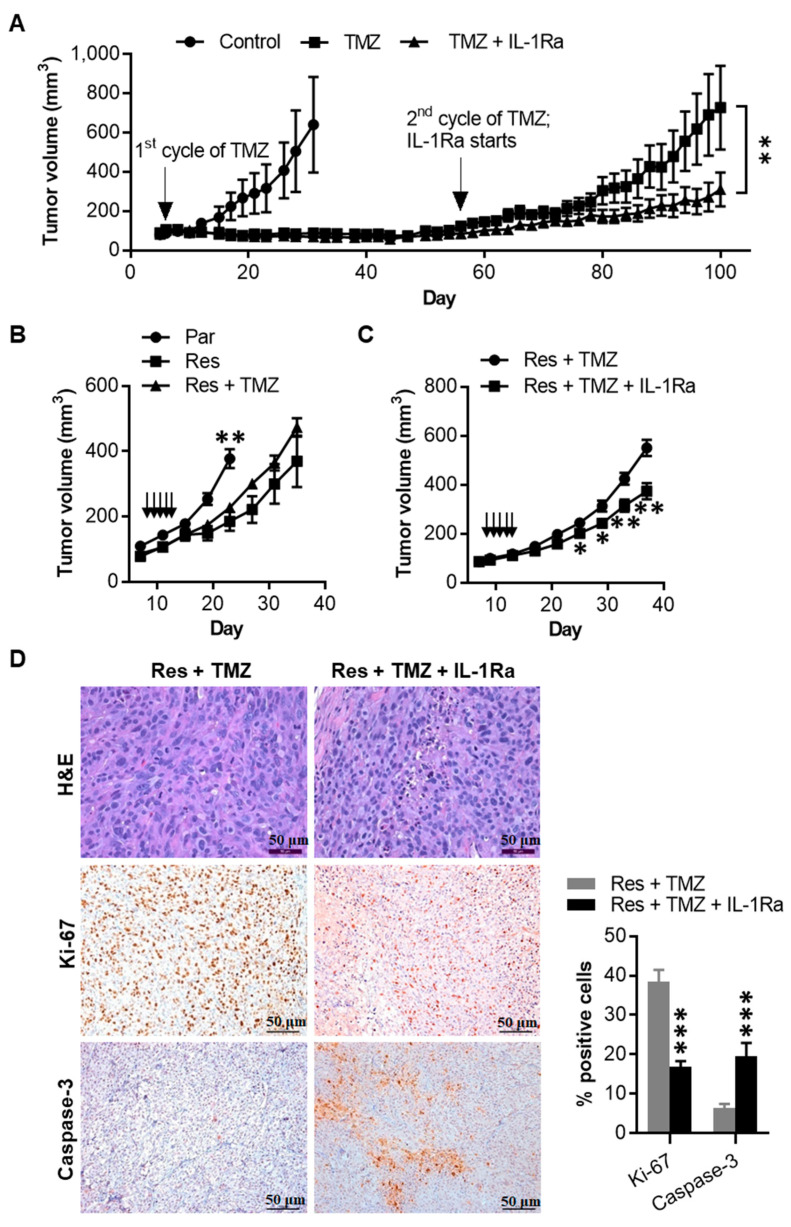
Figure 7.
IL-1Ra inhibits TMZ-resistant 1205Lu tumor growth in vivo. (A) Tumor growth curve of 1205Lu parental cells subcutaneously injected in mice, treated with a TMZ cycle or 10% DMSO (Control) intraperitoneally (indicated by arrow), and further treated with a second cycle of TMZ together with saline or IL-1Ra (daily subcutaneous injection, starting with the second cycle of TMZ and being kept until the end of the experiment on day 100). Data are expressed as the mean ± SEM. n = 4 tumors (Control), 10 tumor (TMZ), or 10 tumors (TMZ + IL-1Ra). (B) Tumor growth curve of 1205Lu parental cells (Par), resistant cells (Res) injected subcutaneously in mice, treated with a cycle of TMZ or 10% DMSO as vehicle control (daily intraperitoneally for five days, indicated by arrows). Tumor growth was monitored for 23 or 35 days (parental or resistant tumors, respectively). Data are expressed as the mean ± SEM. n = 8 tumors per each group. (C) Tumor growth curve of 1205Lu resistant cells (Res) injected subcutaneously in mice, treated with a cycle of TMZ (daily intraperitoneally for five days, indicated by arrows) together with saline or IL-1Ra (daily subcutaneously, starting with TMZ and being kept until the end of the experiment on day 37). Data are expressed as the mean ± SEM. n = 8 tumors (Res + TMZ) or 14 tumors (Res + TMZ + IL-1Ra). (D) Staining of tumor sections from (C) tumors with hematoxylin and eosin (H&E) (upper panel), Ki-67 (middle panel), and caspase-3 (lower panel). Ki-67-positive cells and caspase-3-positive cells were counted in the whole field under a microscope and presented as % positive tumor cells. Bar = 50 μm (H&E) or 100 μm (Ki-67 and caspase-3). Representative images are shown or data are expressed as the mean ± SEM (n = 5). * p < 0.05, ** p < 0.01, and *** p < 0.001 vs the corresponding or indicated tumors (A,C,D) or the combined resistant tumors at the same time point (B).

