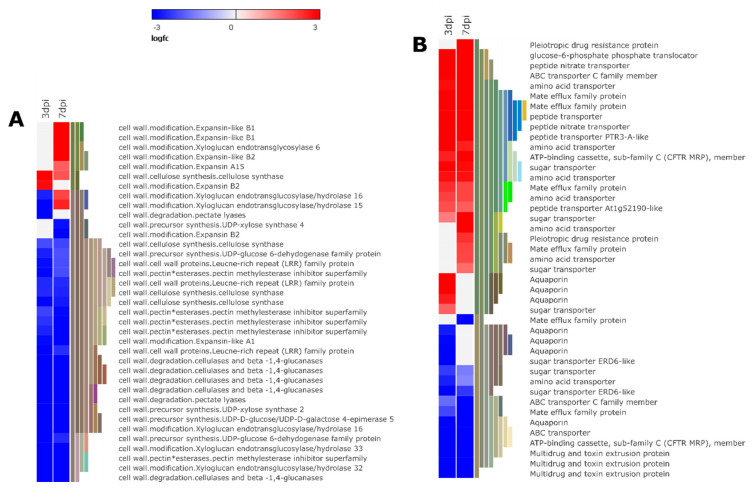
Figure 8.
Heat map representation of gene expression patterns of genes associated with cell wall architecture (A) and transport activity (B). (The heat map illustrates a subset of genes from each group. Refer to supporting information for all differentially expressed genes in each group).

