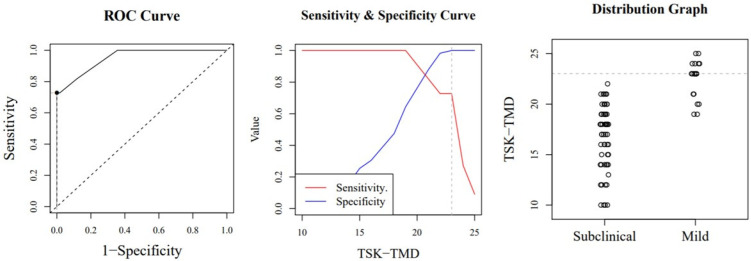
Figure A1.
Optimal cut-off point between levels of jaw kinesiophobia. The image shows a ROC (Receiver Operating Characteristic) curve that represents the sensitivity of a diagnostic test that produces continuous results, depending on false positives (complementary to specificity), for different cut-off points (image on the left), the image where the cut-off point at which the highest sensitivity and specificity is achieved (image in the middle) and finally, a subclinical and mild sample distribution graph (image on the right).

