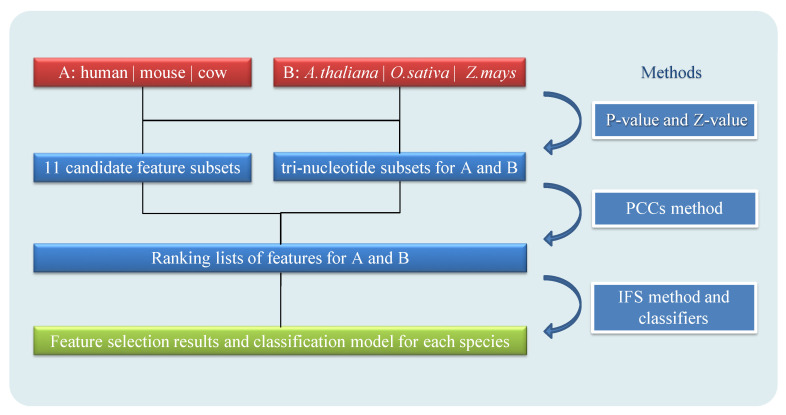
Figure 1.
Model architecture of PreLnc. A presents animals (humans, mice, and cows) and B presents plants (A. thaliana, O. sativa and Z. mays). The FDR (false discovery rate) adjusted P-value and Z-value are used to select tri-nucleotides as candidate feature sets. Pearson correlation coefficients (PCCs) are used to obtain ranking lists of features for feature selection results with the incremental feature selection (IFS) method. Model for each species is based on feature selection results and machine learning classifiers.

