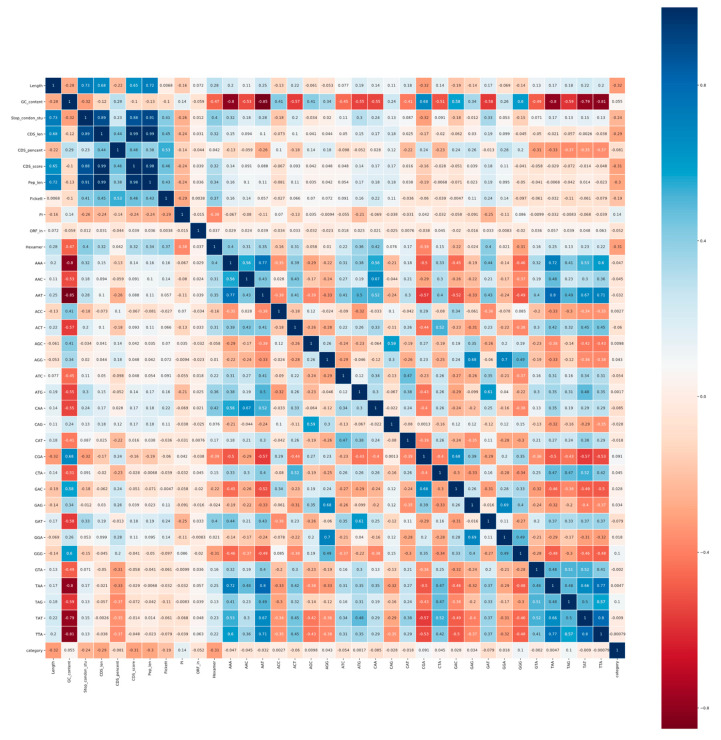
Figure 5.
Pearson correlation coefficients of features on plants. The correlation coefficient is in the form of a heat map between various features and transcript categories. Blue represents a positive correlation and red represents a negative correlation. The darker the color, the stronger the correlation. The description of the feature abbreviations: Length, sequence length; GC_content, GC content; Stop_condon_std, standard deviation of stop codon counts (TAA, TAG, TGA); CDS_len, CDS length; CDS_percent, CDS percentage; CDS_score, CDS score of txCdsPredict prediction; Pep_len, peptide length; Fickett, fickett score; PI, isoelectric point; ORF_in, open reading frame integrity; Hexamer, hexamer score; and the other features, tri-nucleotides. The numerical value of the grid indicates the correlation between these two features. The dark blue area in the upper left corner of the figure shows the high correlation over 0.88 between stop codon counts, CDS length, CDS score and peptide length.

