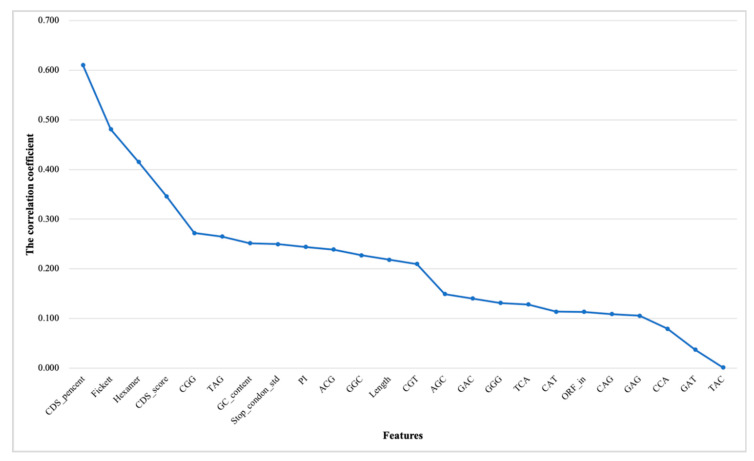
Figure 6.
Ranking correlation coefficients (|r|) of features for animals. The horizontal coordinates represent the features. The vertical coordinates represent the correlation coefficient between the features and the transcription category. The description of the feature abbreviations: CDS_percent, CDS percentage; Fickett, fickett score; Hexamer, hexamer score; CDS_score, CDS score of txCdsPredict prediction; GC_content, GC content; Stop_condon_std, standard deviation of stop codon counts (TAA, TAG, TGA); PI, isoelectric point; Length, sequence length; ORF_in, open reading frame integrity and the other features—tri-nucleotides.

