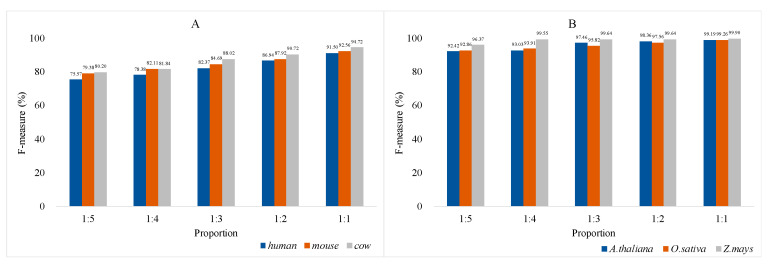
Figure 9.
F-measures of balanced random forests in positive and negative sample sets of 1:5, 1:4, 1:3, 1:2, and 1:1, respectively. The horizontal and vertical coordinates represent proportion and F-measure, respectively. (A) Balanced random forests with 20 features on animals. Balanced random forests perform poorly on uneven animal datasets with F-measure gaps of 15.93% for humans, 13.18% for mice, and 14.52% for cows; (B) Balanced random forests with 33 features on plants. F-measure gaps of plants are smaller (6.77% for A. thaliana, 6.40% for O. sativa, and 3.53% for Z. mays, respectively.

