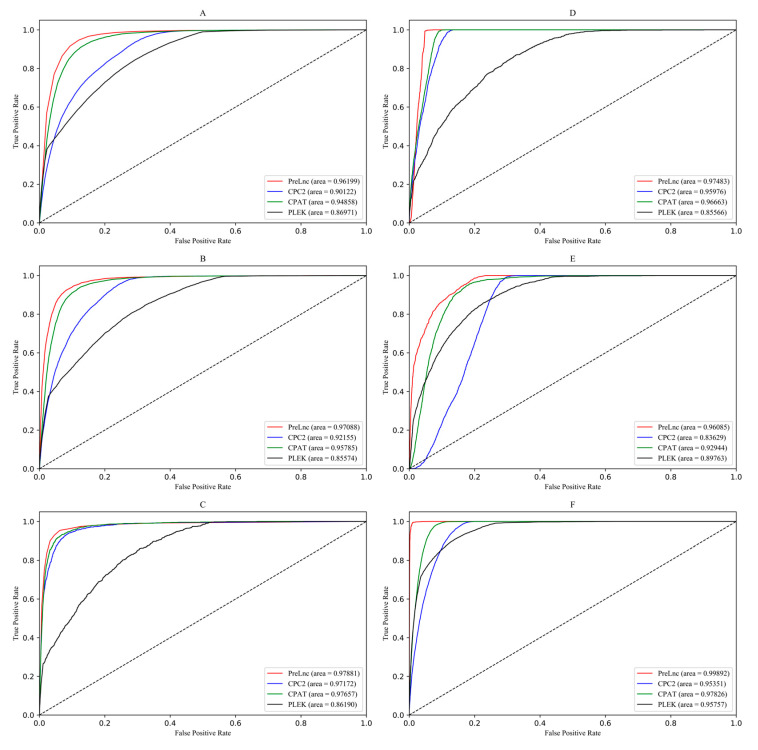
Figure 10.
Receiver operating characteristic curves of 6 species. Different colored curves correspond to different tools (red: PreLnc, blue: CPC2, green: CPAT, black: PLEK). The horizontal and vertical coordinates represent the true positive rate and the false positive rate, respectively. (A) Receiver operating characteristic on humans; (B) Receiver operating characteristic on mice; (C) Receiver operating characteristic on cows; (D) Receiver operating characteristic on A. thaliana; (E) Receiver operating characteristic on O. sativa; (F) Receiver operating characteristic on Z. mays.

