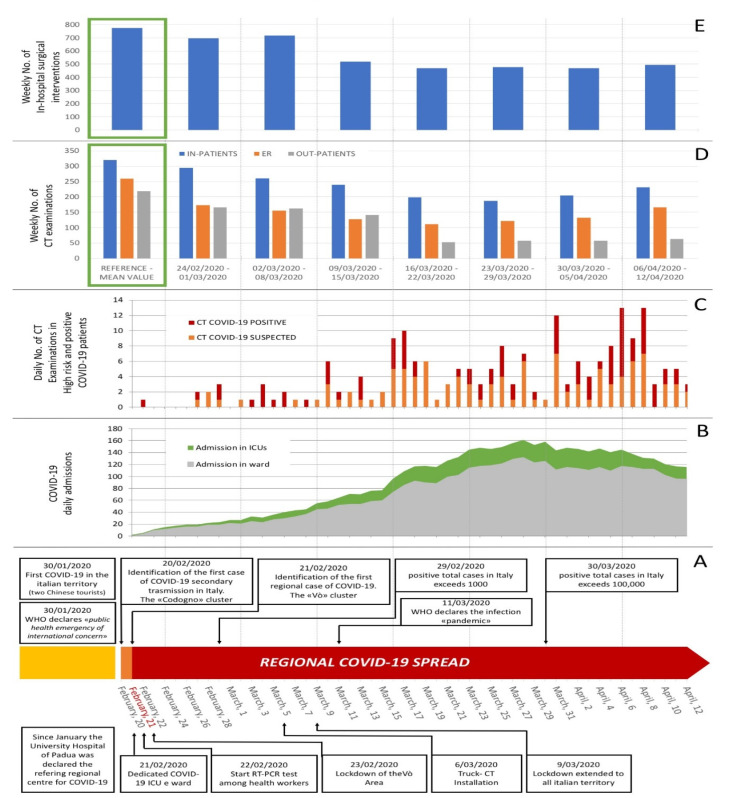
Figure 1.
Hospital workload during Phase 1 of Coronavirus Disease 19 (COVID-19) pandemic, showing mean volume per day and week from 21 February through 12 April 2020, death of first patient in Padova area, and identification of the Vò cluster. The reference timeline highlighting the regional and national steps of the pandemic is represented in (A). Graph (B) shows the daily number of COVID-19 patients admitted to the Intensive Care Unit (ICU) and devoted wards. Graph (C) shows the total daily number of CT (Computed Tomography) examinations performed on COVID-19 positive or suspected patients. Graph (D) shows the total weekly number of CT acquisitions for in-patients, Emergency Room (ER) and out-patients during Phase 1 of the outbreak from Monday 24 February, and graph (E) shows the total weekly number of surgical interventions for in-hospital patients in the same period. Green squares in graph (D) and (E) identify, as a reference, the mean value of the benchmark performance of CT and surgical activities observed in the four weeks before the outbreak. Both CT scans and surgical interventions for in-patients are shown in blue.

