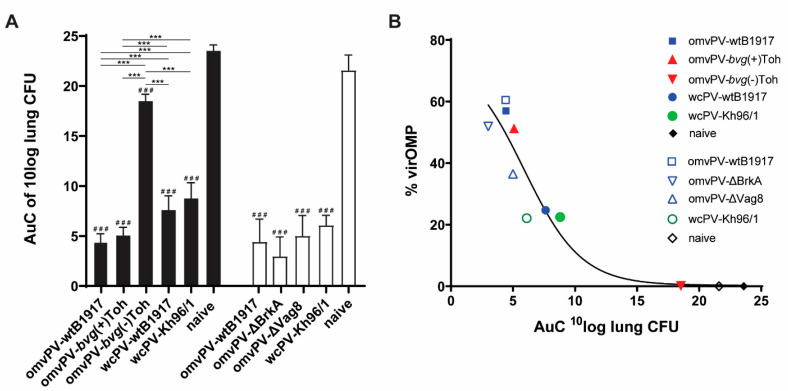
Figure 3.
Relation between percentage of virulence outer membrane proteins (virOMP) and area under the curve (AuC) of lung colonization in mice. (A) The level of protection of all vaccines under test in this study, divided over experiment 1 (black bars) and 2 (white bars), expressed as AuC of 10log lung colony forming units (CFU) during 7 days after intranasal challenge of mice with virulent B. pertussis strain B1917. # is significant difference compared to naive group. Significant differences compared to the naive mice are indicated as # p ≤ 0.05, ## p ≤ 0.01 and ### p ≤ 0.001. Significant differences between experimental groups is depicted with a line between both groups and * p ≤ 0.05, ** p ≤ 0.01 and *** p ≤ 0.001. (B) The % virOMP in all tested vaccines plotted against the AuC of 10log lung colonization as a relation between the % virOMP and AuC of lung colonization in mice using a sigmoidal curve fitting.

