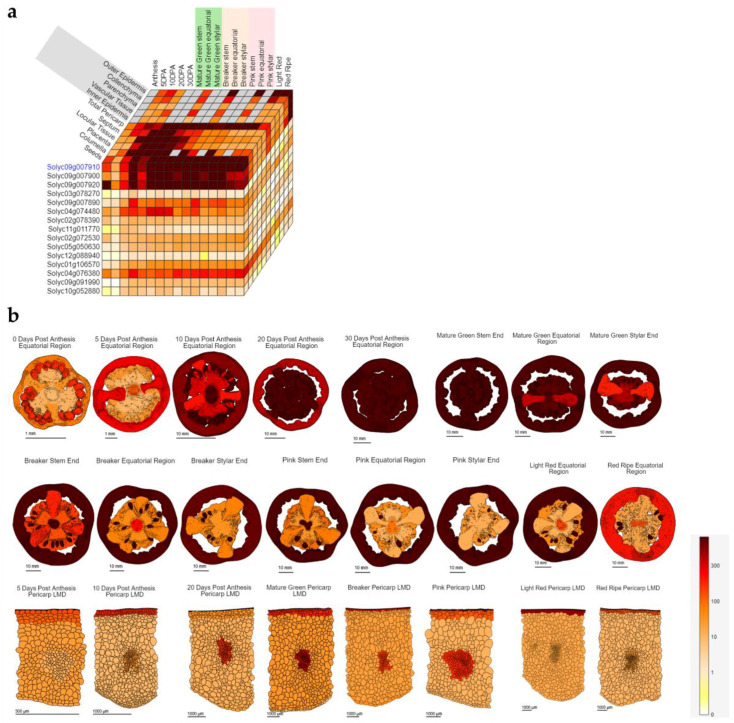
Figure 2.
Example of Tomato Expression Atlas visualization using a phenylalanine ammonia lyase (PAL) gene (Solyc09g007910) as query. In (a) an expression cube with correlated genes; in (b) expression images of PAL in the fruit and its tissues at different developmental stages. The bar refers to the expression intensity in RPM (reads per million).

