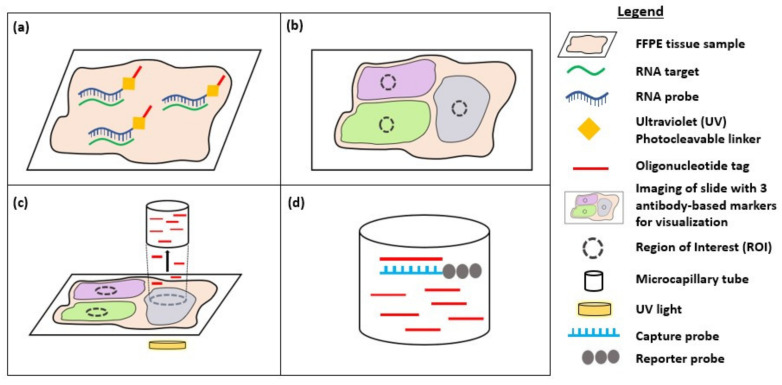
Figure 2.
Diagram showing digital spatial profiling (DSP) for detection of RNA targets. (a) After the FFPE tissue sample undergoes proteinase K digestion, it is incubated with RNA probes that bind to target RNA in the sample. Each RNA probe is conjugated to an oligonucleotide tag via an ultraviolet (UV) photocleavable linker; (b) The slide is stained with 3 antibody-based markers (up to a maximum of 4 markers) and imaged to visualize tissue morphology and enable selection of regions of interest (ROI); (c) Illumination of the ROI with UV light causes the release of photocleavable oligonucleotides from the RNA probes. The oligonucleotides are collected in a microcapillary tube and transferred to a microtiter plate; (d) Spatially resolved pools of oligonucleotides bind to a target-specific reporter probe with a fluorescent barcode via a capture probe. Digital counts from the barcodes are analysed using the nCounter analysis system and mapped back to the region of interest (ROI), providing spatial information about the targets within the ROI.

