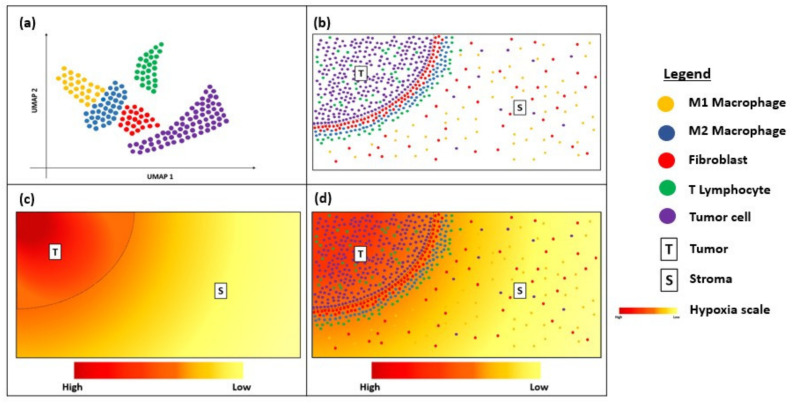
Figure 4.
Diagram showing uniform manifold approximation and projection (UMAP) and hypoxia gradient in a tissue sample. (a) UMAP showing the immune landscape of tumour micro-environment; (b) Immune cells surrounding the tumour border; (c) Hypoxia gradient of tumour micro-environment; (d) Overlay of UMAP and the hypoxia gradient to visualize heterogeneity of the tumour micro-environment.

