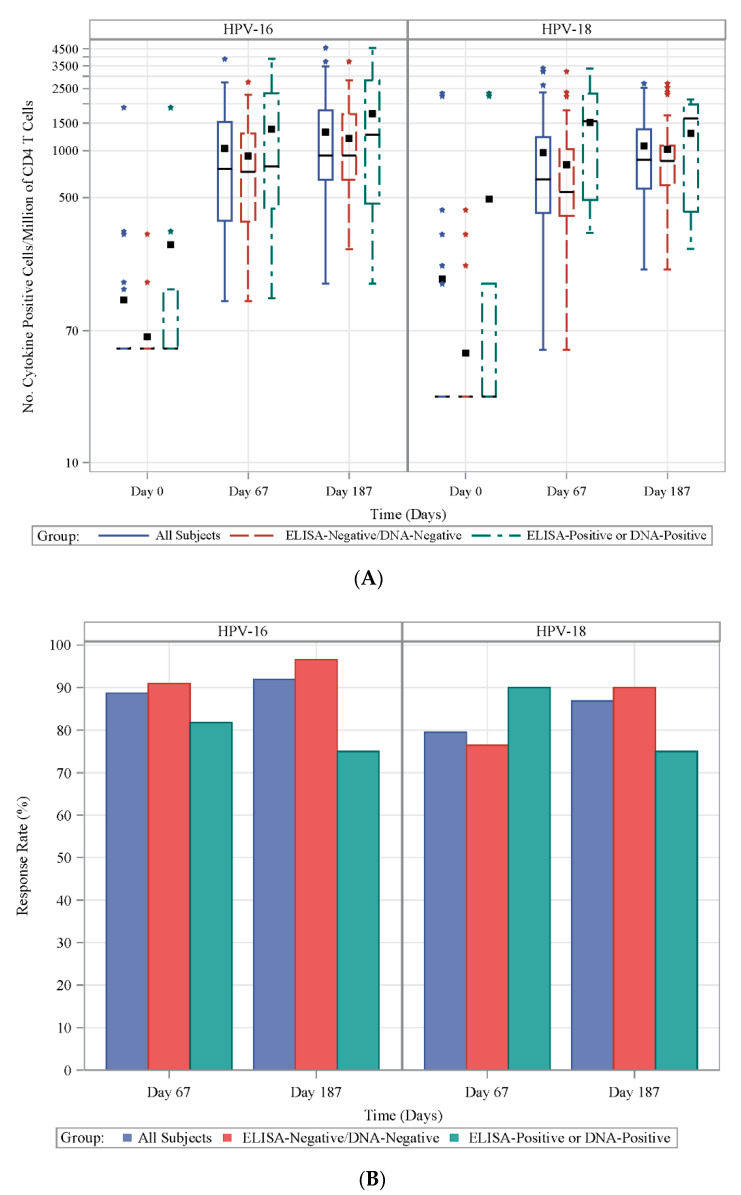
Figure 2.
Frequency and proportion of responders of HPV-specific CD4+ T cell induced by 4vHPV vaccination. (A) Frequency of HPV-16- (left panel) and HPV-18 (right panel)-specific CD4+ T cell response at Days 0, 67 and 187 in the prospective cohort for all (solid blue line), HPV-naïve (dashed red line) and HPV-exposed (dashed green line) subjects expressed as the number of total IFNγ, IL-2, IL-4 and IL-21 expressing cells per millions of total CD4 T cells; (B) proportion of responders for HPV-16- (left panel) and HPV-18 (right panel)-specific CD4+ T cell response at Days 67 and 187 in prospective cohort defined as subjects whose value was greater than the baseline value and with >180 HPV-16+ or >296 HPV-18+ CD4 T cells per million of total CD4 T cells for all (blue bar), HPV-naïve (red bar) and HPV-exposed (green bar) subjects.

