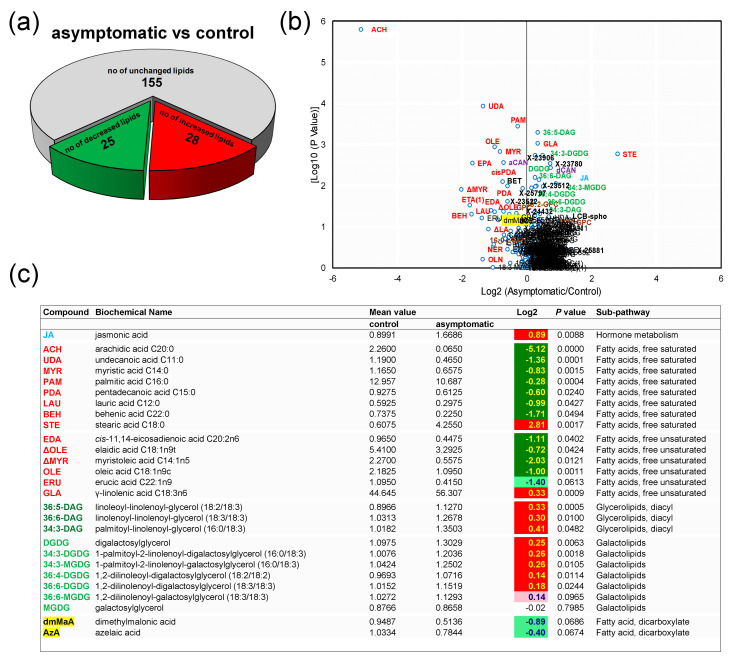
Figure 2.
Variations in levels of hormones, lipid species, and other compounds of the metabolism of lipids in Vitis vinifera L. ‘Malvasia fina’ affected by Esca complex disease (ESCA): (a) Pie plot representing the numbers of altered species in healthy leaves from foliar-asymptomatic and wood-symptomatic vines (ASY) relative to healthy leaves from healthy unaffected control vines (CTL). Levels were considered altered when they underwent a p-value ≤ 0.10 (Welch’s two-sample t-test, n = 6). (b) Volcano plot (log2 (ASY/CTL) vs. [log10 (p-value)]) illustration of species differently accumulated in CTL and ASY. Abbreviations are as listed in Figure 2c and Table S1. (c) Representative compounds listed along a color gradient according to sub-pathways. Additional altered compounds can be found in Table S1. For log2 values, different colors represent different directions of change at p ≤ 0.05 (dark green = negative change; red = positive change) and at p ≤ 0.10 (light green = negative change; rose = positive change).

