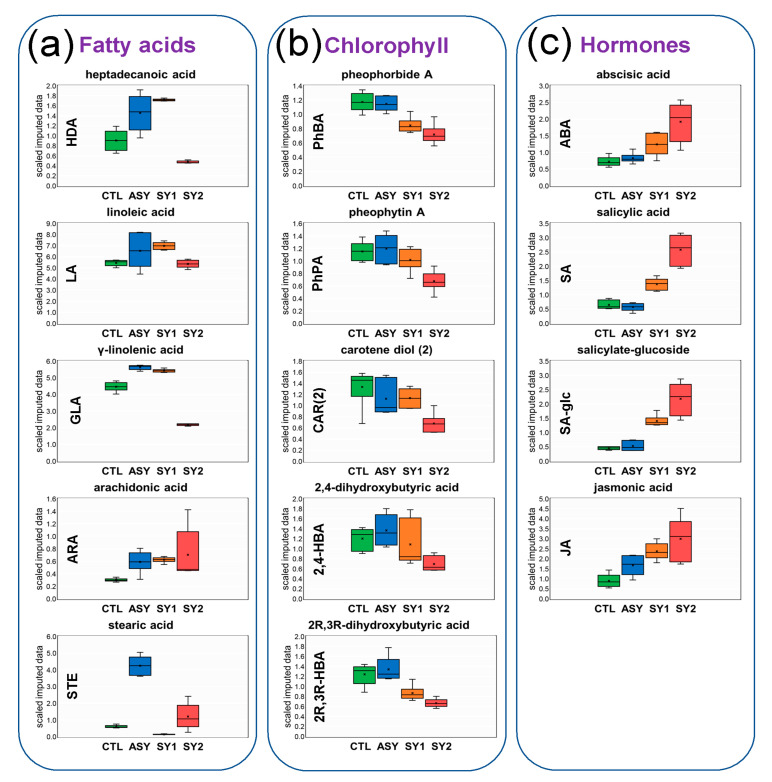
Figure 6.
Box-And-Whisker plots corresponding to hormones, lipid species, and other compounds of the metabolism of lipids with specific and consistent changes in response to Esca complex disease (ESCA) in Vitis vinifera L. ‘Malvasia Fina’ leaves. Scaled imputed data were calculated by median value normalization of area-under-the-curve detector ion counts for each compound (names on the top and abbreviations on the Y-axis). The rounder corner shapes delimit a cluster of individuals of similar sub-pathways: (a) Free FAs, (b) hydroxy FAs and metabolites of chlorophyll/carotenoid metabolism, and (c) hormones. CTL = healthy leaves from healthy unaffected control vines, ASY = healthy leaves from foliar-asymptomatic and wood-symptomatic vines, SY1 = chlorotic leaves from foliar-symptomatic and wood-symptomatic vines, SY2 = spotted/scorched leaves from foliar-symptomatic and wood-symptomatic vines. High levels of ARA probably produced by grapevine pathogens were found and the compound included in the analyses.

