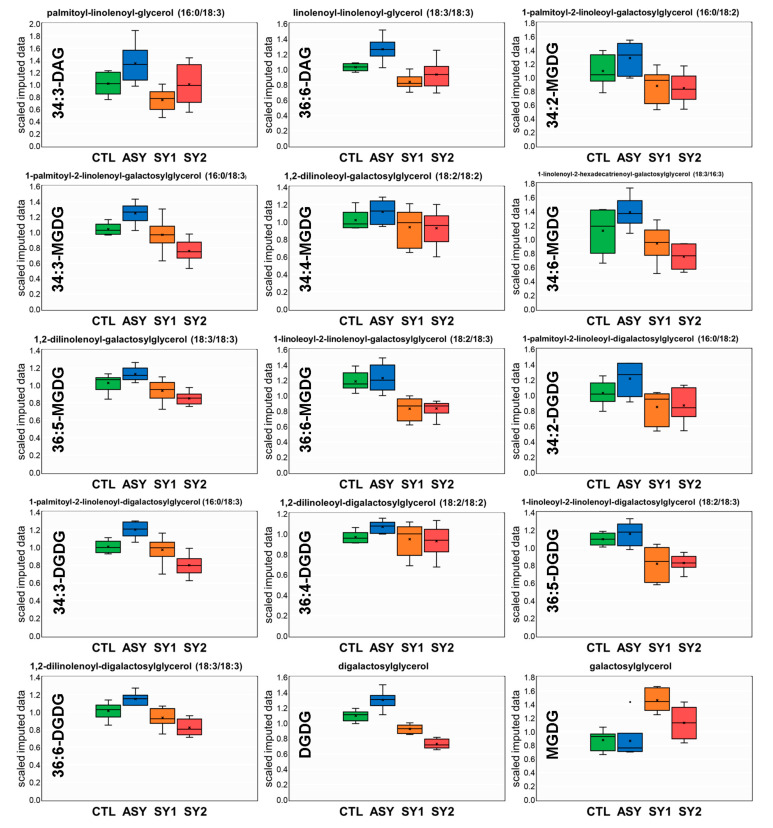
Figure 7.
Galactolipid and diacylglycerolipid profiles (names on the top and abbreviations on the Y-axis) of leaves of Vitis vinifera L. ‘Malvasia Fina’ affected by Esca complex disease (ESCA). Levels of individual lipid species are expressed as scaled imputed data, as detailed in the Materials and Methods Section. CTL = healthy leaves from healthy unaffected control vines, ASY = healthy leaves from foliar-asymptomatic and wood-symptomatic vines, SY1 = chlorotic leaves from foliar-symptomatic and wood-symptomatic vines, SY2 = spotted/scorched leaves from foliar-symptomatic and wood-symptomatic vines.

