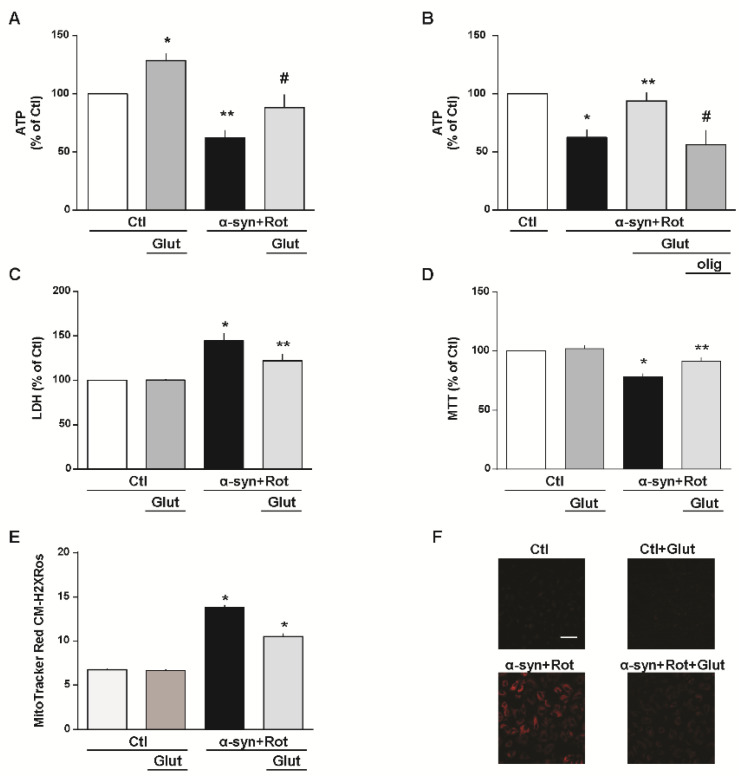
Figure 2.
Glutamate recovery of cell injury, reactive oxygen species (ROS) overproduction and ATP synthesis reduction induced by α-syn plus Rot. Effect of 1 h exposure to glutamate under physiological conditions on ATP synthesis (A), extracellular LDH release (C), mitochondrial activity (D) and mitochondrial ROS production (E). A,B Intracellular ATP levels after 24 h exposure to α-syn (10 nM) plus Rot (300 nM) and 23 h exposure to α-syn (10 nM) plus Rot (300 nM) followed by 1 h exposure to glutamate (500 µM) in the absence (A) or in the presence of oligomycin (3 µg/mL) (B). In each experiment, ATP levels were normalized to the respective protein content and expressed as percentage of the control. (C,D) Cell injury, assessed by means of extracellular LDH and MTT assays, and (E,F) mitochondrial ROS production, assessed by measuring MitoTracker Red CM-H2XRos fluorescence intensity, were evaluated after 24 h exposure to α-syn (10 nM) plus Rot (300 nM), in the presence or in the absence of glutamate. Where indicated, glutamate (500 µM) was added during the last hour of the α-syn+Rot treatment. In each experiment, extracellular LDH release and MTT reduction were expressed as percentage of the control. (F) Representative images of mitochondrial ROS by MitoTracker Red CM-H2XRos staining. Images are representative of n = 4 independent experiments. Scale bar = 50 µm. Statistical differences were assessed by one-way ANOVA followed by Dunnet’s post hoc test. (A) F (3,20) = 14.85. Each column represents the mean ± S.E.M. of n = 6 independent experiments performed in triplicate. * Significant versus all groups (p < 0.05 versus Ctl, p < 0.0001 versus α-syn+Rot, p < 0.01 versus α-syn+Rot+Glut); ** significant versus all groups (p < 0.01 versus Ctl, p < 0.0001 versus Ctl+Glut, p < 0.05 versus α-syn+Rot+Glut); # significant versus Ctl+Glut (0.01) and α-syn+Rot (0.05). (B) F (3,12) = 7.902. Each column represents the mean ± S.E.M. of n = 4 independent experiments performed in triplicate. * Significant versus Ctl and α-syn+Rot+Glut (p < 0.05); * significant versus α-syn+Rot and α-syn+Rot+Glut+olig (p < 0.05); # significant versus Ctl (p < 0.01) and α-syn+Rot+Glut (p < 0.05). (C) F (3,37) = 13.64. Each column represents the mean ± S.E.M. of at least n = 8 independent experiments performed in triplicate. * Significant versus all groups (p < 0.0001 versus control groups, p < 0.05 versus α-syn+Rot+Glut); ** significant versus Ctl and α-syn+Rot (p < 0.05). (D) F (3,17) = 19.37. Each column represents the mean ± S.E.M. of at least n = 3 independent experiments performed in triplicate. * Significant versus all groups (p < 0.0001 versus control groups, p < 0.01 versus α-syn+Rot+Glut); ** significant versus Ctl+Glut (p < 0.05) and α-syn+Rot (p < 0.01). (E) F (3,1714) = 188.9. The bar plot reports the mean ± S.E.M. of fluorescence increase elicited by ROS formation. For each experimental group, basal values used for the statistical analysis derived from n = 4 independent experiments, and 100–150 cells were recorded for each session. * Significant versus all groups (p < 0.0001). Olig = oligomycin.

