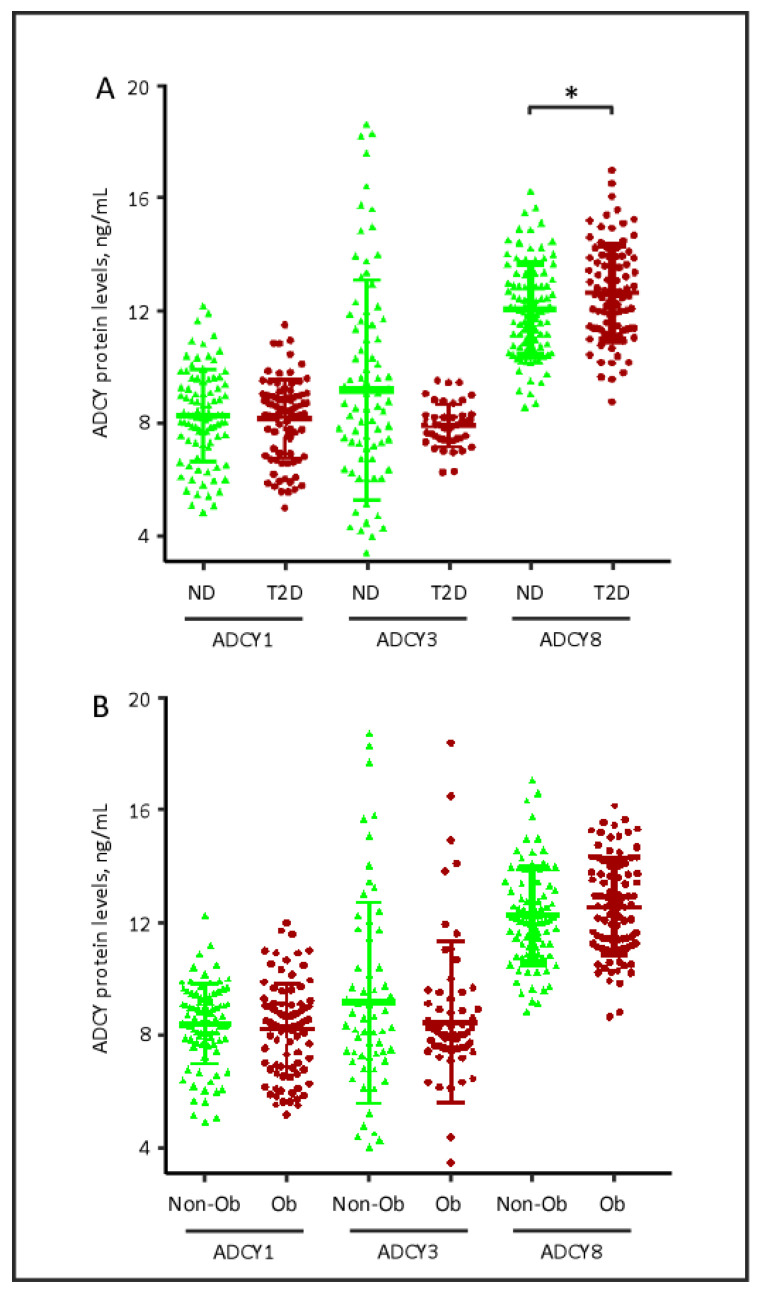
Figure 1.
Quantitative analysis of plasma ADCY1, ADCY3 and ADCY8 in (A) subjects with and without T2D and in (B) subjects with and without obesity. Data are presented as mean ± SD. ADCY, adenylate cyclase; ND, non-diabetic; T2D, type 2 diabetes; Non-Ob, non-obese; Ob, Obese. * p = 0.017). p-Value was calculated using unequal variance t-test.

