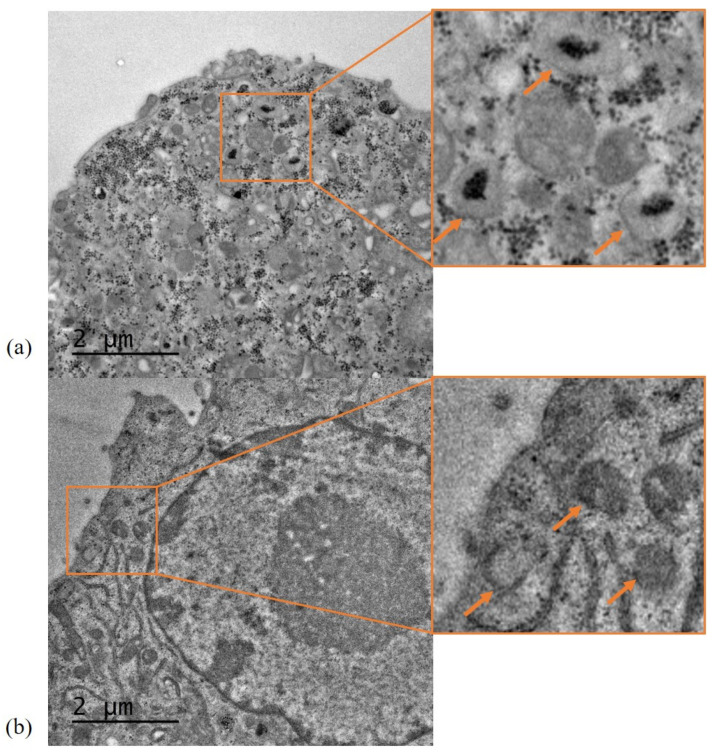
Figure 6.
TEM micrographs of SLN-A nanoparticle uptake by DC2.4 cells. (a) Cells treated with SLN-A nanoparticles; (b) Control cells without nanoparticle treatment. Nanoparticle uptake was evident within cells treated with SLN-A nanoparticles (image a), with aggregation in endosomes (inset). No nanoparticle uptake was seen in the control cell sample (image b), where empty endosomes were observed (inset). Scale bar 2 µm.

