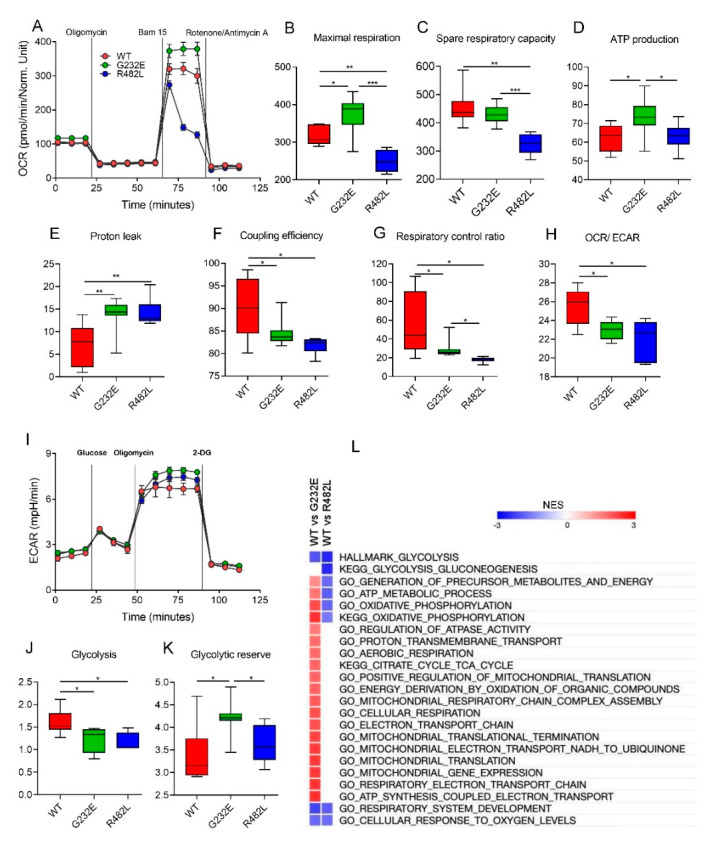
Figure 4.
Metabolic profiles of C2C12 myotubes bearing lentiviral WT/G232E/R482L-LMNA. (A–H): Determination of mitochondrial bioenergetic parameters from OCR profile. (A) OCR traces for myotubes expressing WT/G232E/R482L-LMNA; (B–G) Indices of mitochondrial respiratory function: (B) maximal respiratory capacity; (C) spare respiratory capacity; (D) ATP-linked respiration; (E) proton leak respiration; (F) coupling efficiency; (G) cell respiratory control ratio; (H) OCR/ECAR ratio at maximal respiration. OCR was measured at the same time as ECAR. (I–L): Determination of glycolytic function. (I) Kinetic profiles of ECAR in myotubes expressing WT/G232E-LMNA/R482L-LMNA. ECAR was measured in real time, as indicated. Indices of glycolytic pathway activation calculated from ECAR profile: (J) Maximal glycolysis and (K) glycolytic reserve capacity. All data are calculated from 6–8 Seahorse microplate wells and are normalized to total protein in each well. * p < 0.05; ** p < 0.01 *** p < 0.001; two-tailed Student’s t-test. All floating bars are shown with mean, minimum and maximum values. (L) Heat map of NES values after GSEA analysis represents metabolic pathways found up- or down-regulated in G232E/R482L myotubes compare with WT-LMNA; FDR = 0.05.

