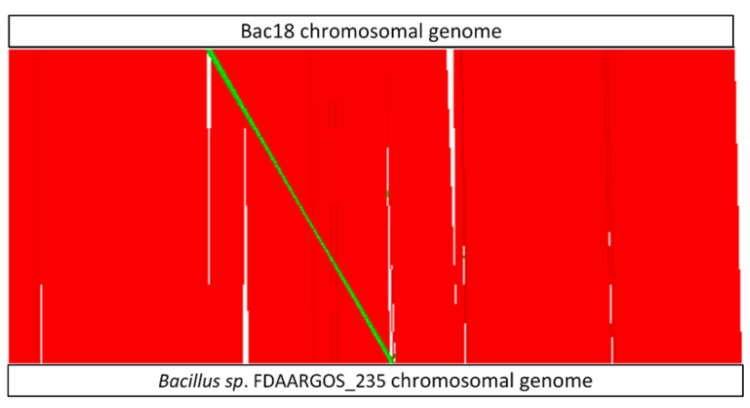
Figure 3.
Visualization of the structural similarities of Bac18 and Bacillus sp. FDAARGOS_235 chromosomal genomes calculated with Nucmer. Genomes are given as white boxes at the top (Bac18) and the bottom (Bacillus sp.) of the illustration. For comparison, both circular genomes are opened at the starting position of the dnaA gene. Red: homologous sequences with the same orientation; green: reverse complement, but homologous sequences, white: regions without homologies.

