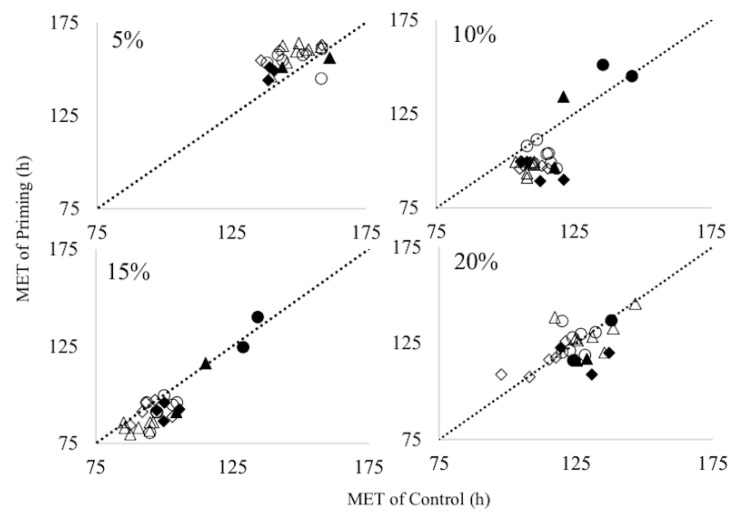
Figure 2.
Relationship between control and priming of mean emergence time (MET) in the four soil moisture conditions. The dotted line indicates position of the x value equal to y value. Each plot shows one condition. Black circles, black rhombuses, white circles, white rhombus, black triangles and white triangles indicate genotype group1, 2, 3, 4, 5 and 6, respectively. Genotype groups are determined by cluster analysis (illustrated in Figure 2).

