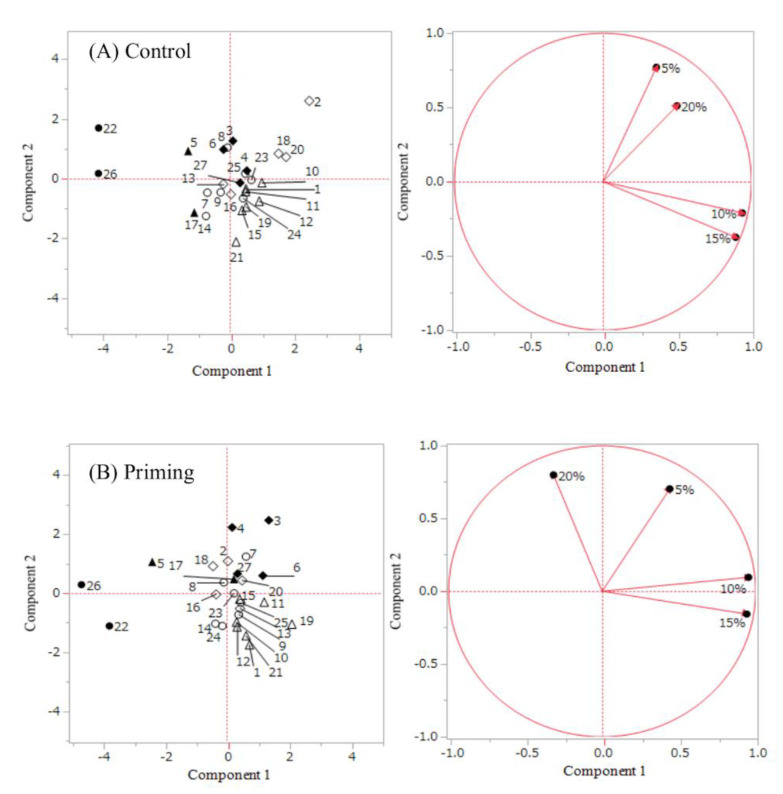
Figure 3.
Results of principle component analysis of 27 genotypes based on mean emergence time (MET). (A) and (B) shows result of control and priming, respectively. Component 1 and 2 of (A) accounted for 51.5 and 25.9, respectively. Component 1 and 2 of (B) accounted for 52.2 and 29.2, respectively. MET was modified to negative values and analyzed. Each number shows one genotype (genotype numbers are illustrated in Table 1). Black circles, black rhombuses, white circles, white rhombus, black triangles and white triangles indicate genotype group1, 2, 3, 4, 5 and 6, respectively. Genotype groups are determined by cluster analysis (illustrated in Figure 1).

