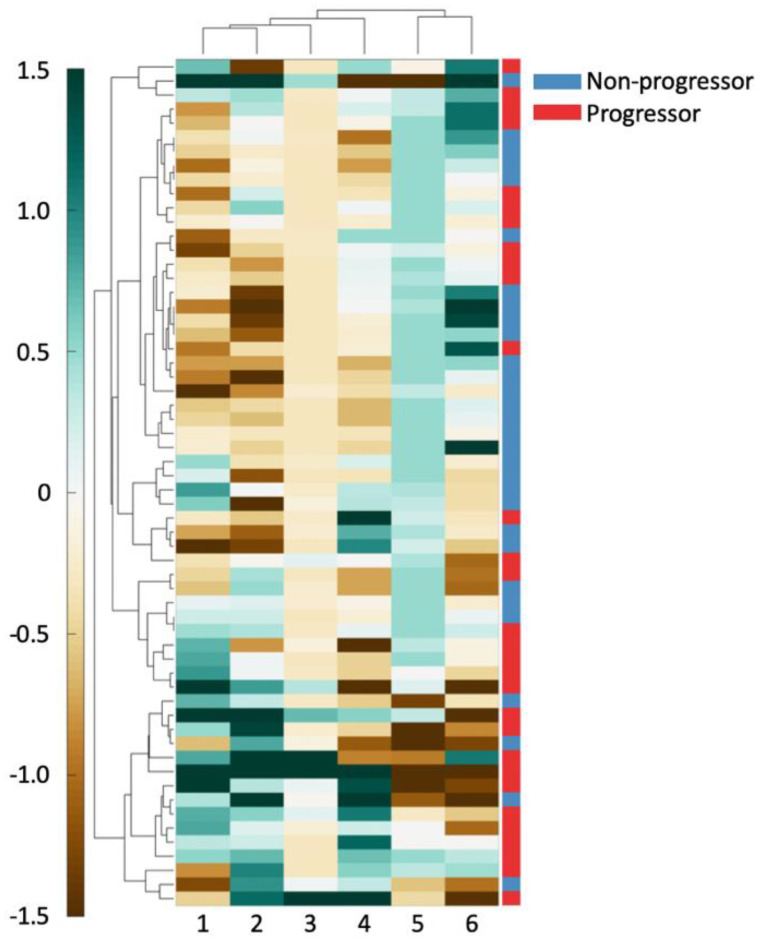
Figure 2.
The 6 features used to create a clustergram on D1. Features and patients were clustered hierarchically. The shading of each cell shows the relative over- or under-expression of that feature in a patient. From left to right, the features are: (1) standard deviation of minimum/maximum nuclear radius, (2) minimum/maximum nuclear perimeter, (3) minimum/maximum ratio of Voronoi polygon perimeter, (4) standard deviation of nuclear shape’s Fourier descriptor 6, (5) tensor contrast inverse moment range, and (6) standard deviation of Voronoi polygon area.

