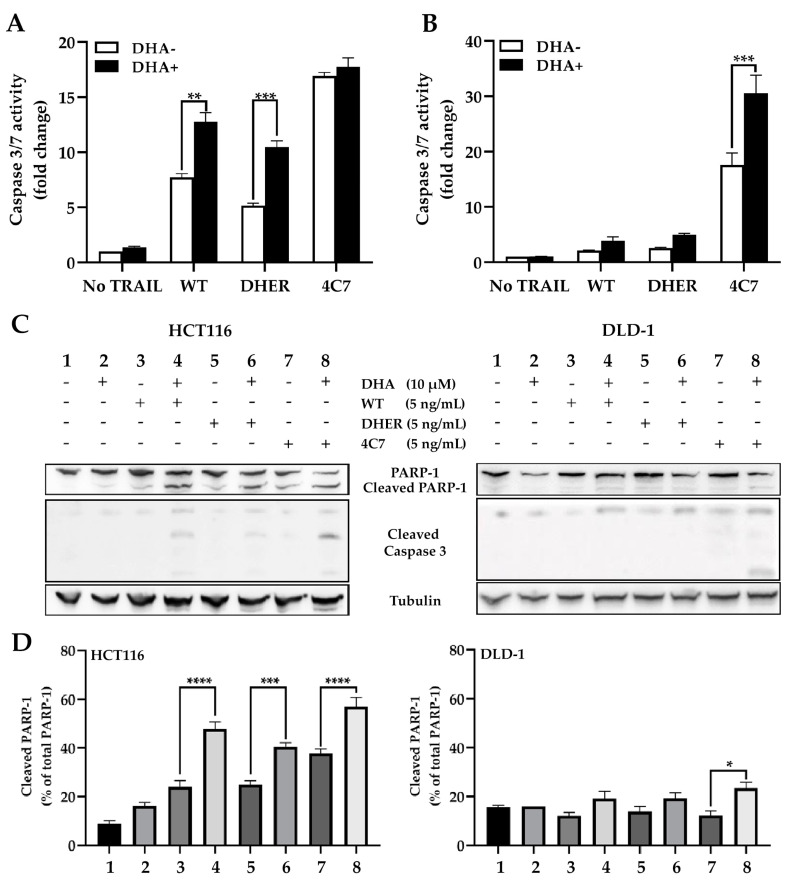
Figure 4.
DHA activates caspase-mediated cell death differently through the two receptors. The caspase-3/7 activity was performed on HCT116 (A) and DLD-1 (B), and the luminescence was measured after 1 h reagent incubation. Data shown are mean ± SEM from two independent experiments performed in triplicate. (C) Western blot analysis of full-length PARP-1, cleaved PARP-1, and cleaved caspase-3 using γ-Tubulin as the loading control. (D) The cleaved PARP-1 relative to total PARP-1 was calculated based on integrated density relative to γ-Tubulin. Figure S1A,B show the original Western blot. All cells were treated with 10 μM DHA for 30 min, followed with/without 5 ng/mL rhTRAIL WT, DHER, or 4C7 for 12 h to check the caspase-3/7 activity, 24 h for Western blot. p values were analyzed by two-way ANOVA with Sidak’s multiple comparisons test in Graphpad Prism version 8.0. * 0.01 < p ≤ 0.05, ** 0.001 < p ≤ 0.01, *** 0.0001 < p ≤ 0.001, **** p ≤ 0.0001.

