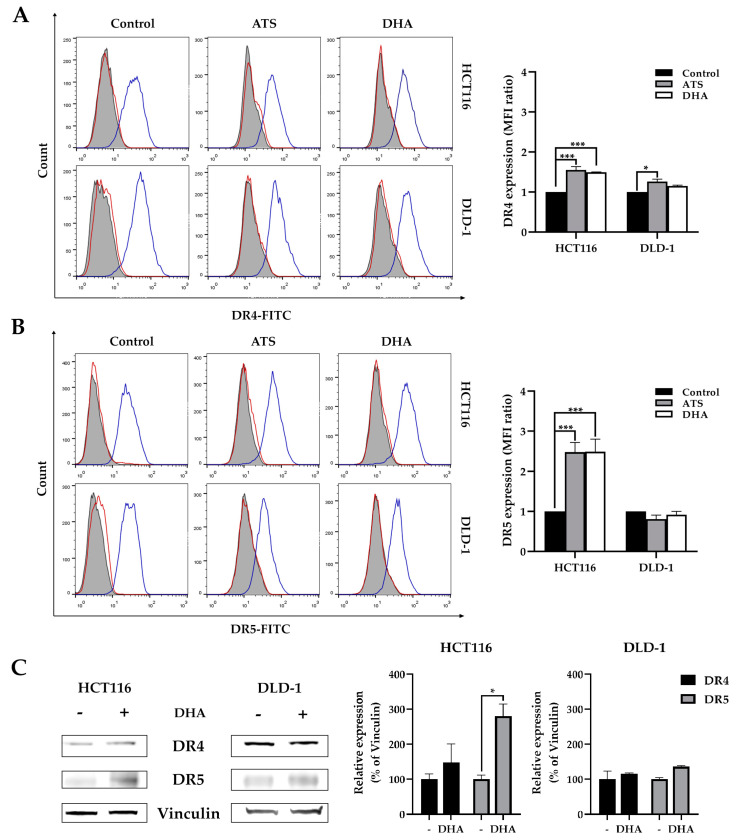
Figure 6.
Artemisinin derivatives upregulate death receptor expression mainly in HCT116. HCT116 and DLD-1 were treated with 10 μM ATS/DHA for 24 h and harvested to analyze cell surface DR4 (A) and DR5 (B) expression by immunofluorescent staining followed with flow cytometry. The left panel shows the histograms of death receptors, and the right figures show the mean fluorescence intensity (MFI) ratio relative to IgG isotype (red open line). The filled grey peaks represent unstained cells, and blue open lines represent DR4 or DR5, respectively. (C) DR4 and DR5 expression in 10 μM DHA treated HCT116 and DLD-1 using vinculin as the loading control. Figure S1C shows the original Western blot. Data shown are mean ± SEM from two independent experiments. p values were analyzed by two-way ANOVA with Tukey’s multiple comparisons test in Graphpad Prism version 8.0. * 0.01 < p ≤ 0.05, *** 0.0001 < p ≤ 0.001.

