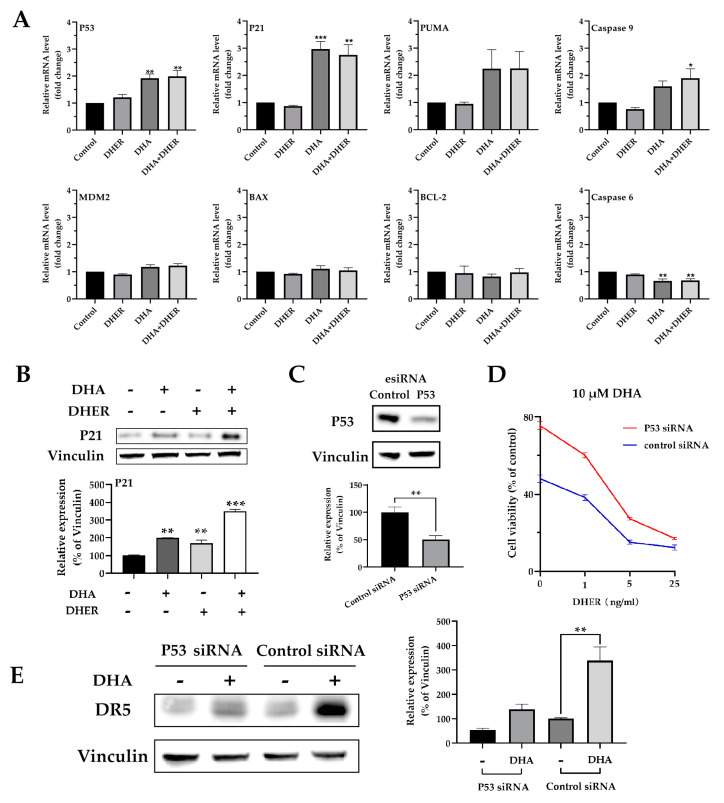
Figure 7.
DHA influences the p53 pathway in HCT116. (A) Relative mRNA levels of P53, P21, PUMA, caspase-9, MDM2, BAX, BCL-2, and caspase-6 in HCT116. (B) Western blot analysis of P21 (upper) and the integrated density of P21 relative to vinculin (bottom). p values were compared with control cells in each group. The cells were treated with 10 μM DHA for 30 min, followed with/without 5 ng/mL DHER for 24 h. (C) The Western blot analysis of P53 in HCT116 after 72 h control siRNA or P53 siRNA transfection. HCT116 cells were transfected with control siRNA or P53 siRNA for 48 h, followed with 24 h treatment. Then, the MTS (D) or Western blot of DR5 (E) were performed. Figure S3 shows the original Western blot. Relative gene expression (normalized to GAPDH) was analyzed by qRT-PCR and transduced with control. p values were analyzed by two-way ANOVA with Dunnett’s multiple comparisons test in Graphpad Prism version 8.0. * 0.01 < p ≤ 0.05, ** 0.001 < p ≤ 0.01, *** 0.0001 < p ≤ 0.001.

