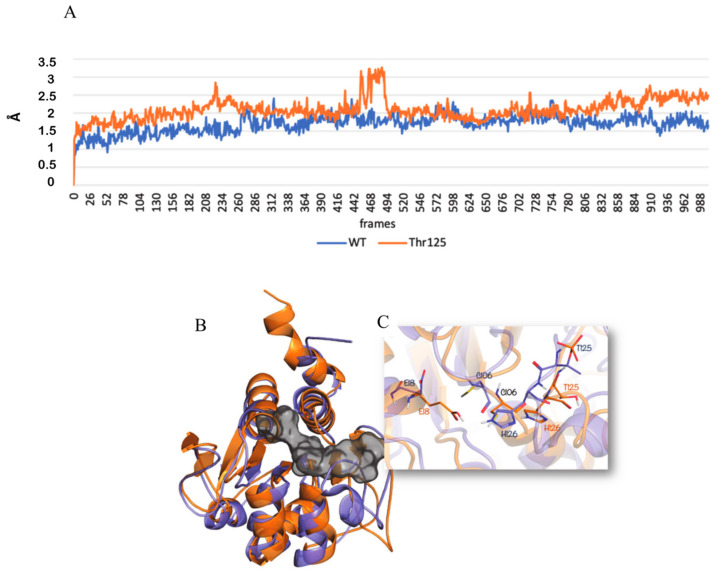
Figure 7.
(A) Root Mean Square Deviation (RMSD) trend of non-phosphorylated DJ-1 (blue line) and phosphorylated DJ-1 at position 125 (orange line); 3D representation of (B) DJ-1 protein non-phosphorylated and DJ-1 protein phosphorylated overlapped, shown as orange and slate cartoon, respectively. The catalytic binding site is represented as a gray surface; (C) DJ-1 catalytic binding site, the residues are shown as orange and slate sticks for the non-phosphorylated and phosphorylated DJ-1, respectively.

