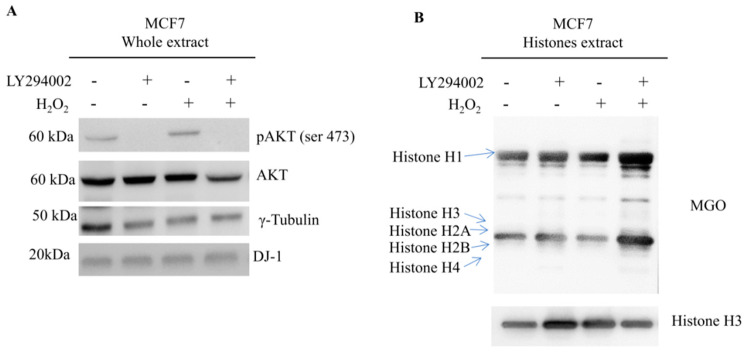
Figure 9.
Western blot analysis relative to the expression of Akt activation and AGEs formations in MCF7 breast cancer cells (A) Western blot analysis on whole extract from MCF7. Levels of Phospho-Akt and DJ-1 are shown in loading control and treated cells. Signals of Phospho antibody were normalized against the total level of Akt. A goat polyclonal anti-γ-Tubulin antibody (C-20) was used to confirm equal loading of whole proteins. Proteins were resolved using Any kD Mini-PROTEAN TGX Precast Protein Gels and blotted using trans-blot turbo system (Bio-Rad). Signals intensities were assessed by densitometry using the Alliance 4.7 software; (B) Western blot analysis on histones extracts from MCF7. Levels of MGO are shown in loading control and treated cells for each histone isoforms resolved on the gel. The major level of MGO are detected on Histone H1. Histones were resolved using 15% Mini-PROTEAN TGX Precast Protein Gels and blotted using trans-blot turbo system (Bio-Rad). Signals intensities were assessed by densitometry using the Alliance 4.7 software.

