Figure 7.
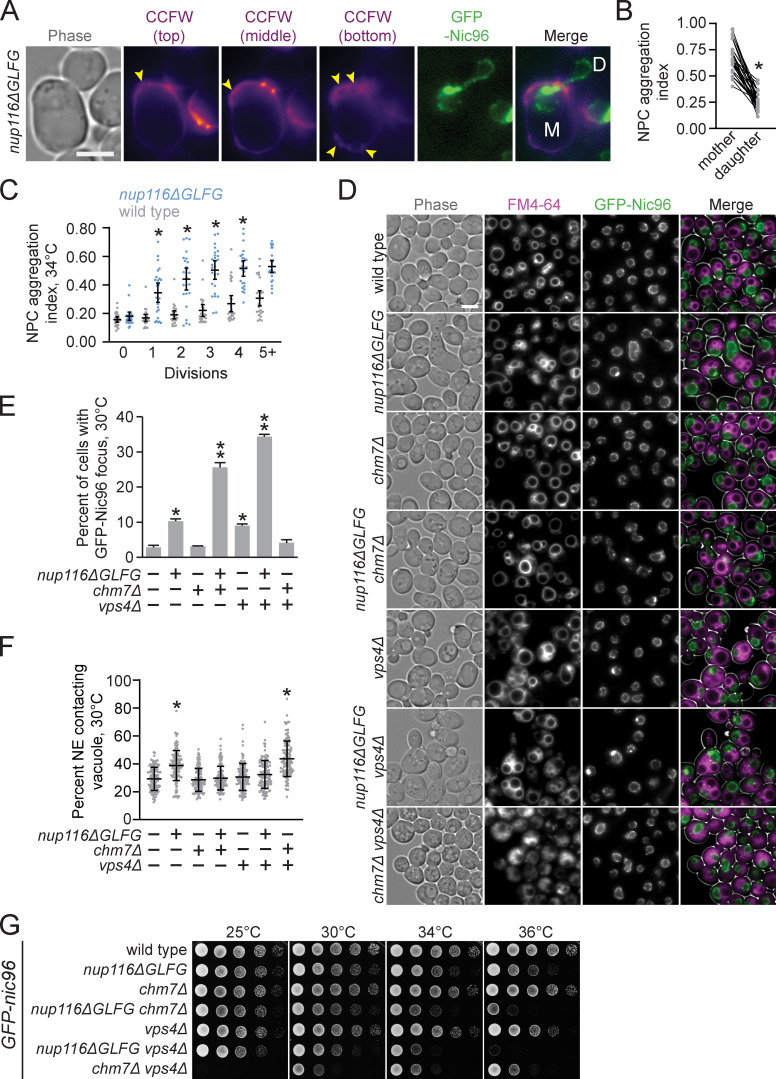
NPC clustering in nup116ΔGLFG cells is CHM7-independent. (A) Calcofluor white (CCFW)-stained GFP-nic96 nup116ΔGLFG cell grown at 34°C that underwent 6 divisions. Mother cell is labeled with an “M”, while undivided daughter is labeled with a “D”; arrowheads point to bud scars. Scale bar, 5 µm. (B) NPC aggregation indices from undivided mother cells with mother and daughter nuclei. Each left dot represents one mother nucleus, connected with its corresponding daughter nucleus on the right. *, P ≤ 0.001 using a paired two-tailed Wilcoxon test. (C) NPC aggregation index versus division number for GFP-nic96 strains at 34°C. Each dot represents values from one cell (n ≥ 20); error bars represent SD. *, P ≤ 0.05 compared with wild type using Dunn’s post hoc test for the given division number. (D) FM4-64–stained GFP-nic96 cells grown at 30°C. Scale bar, 5 µm. (E) Percentage of cells with at least one GFP-Nic96 focus from cells grown at 30°C. Error bars represent SD. *, P ≤ 0.01 compared with wild type using an unpaired two-tailed Student’s t test (n ≥ 100 from three independent trials); **, P ≤ 0.01 when also compared with nup116ΔGLFG or vps4Δ. (F) NE–vacuole contacts in the listed GFP-nic96 strains grown at 30°C. Error bars represent SD. Each dot corresponds to the value from an individual cell (n = 120 from three independent trials). *, P ≤ 0.01 compared with wild type using Dunn’s post hoc test. (G) Serial dilutions of GFP-nic96 strains on YPD plates.

