Figure S1.
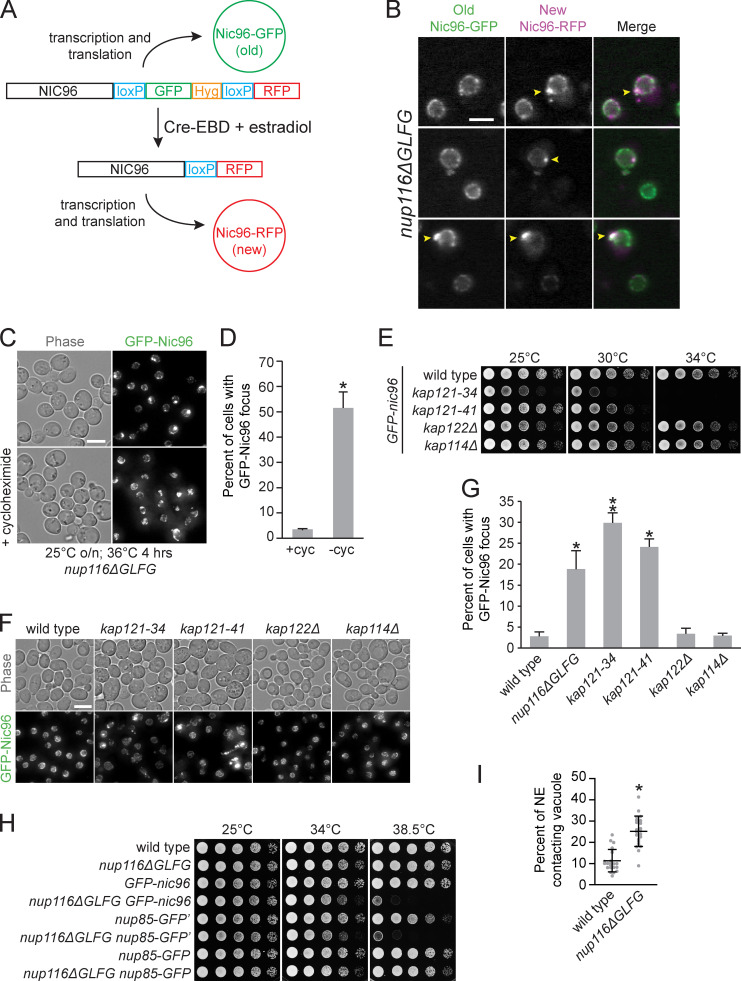
NPC assembly is disrupted in nup116ΔGLFG and kap121 mutants. (A) Diagram of RITE cassette used to distinguish between old (GFP) and newly produced (RFP) Nic96 in cells expressing Cre-estradiol-binding domain (EBD). In the absence of β-estradiol, Nic96-GFP is produced. When β-estradiol is introduced, the GFP tag is excised via the surrounding LoxP sites, causing Nic96-RFP to be produced. (B) Images of nup116ΔGLFG yeast expressing both new (RFP) and old (GFP) forms of Nic96 after a 3-h incubation with 5 µM β-estradiol at 25°C, followed by incubation at 36°C for 3 h to induce production of Nic96 foci (arrowheads). RFP foci formed either without any preexisting GFP foci (top two panels) or exclusively at preexisting GFP foci (bottom panel) that likely began to form at 25°C. Scale bar, 5 µm. (C) Maximum projections of GFP-nic96 nup116ΔGLFG yeast that were grown to midlog phase at 25°C, then shifted to 36°C for 4 h in the absence (top) or presence (bottom) of 10 µg/ml cycloheximide. Scale bar, 5 µm. (D) Percentage of cells ± cycloheximide with GFP-Nic96 focus; *, P ≤ 0.001 using unpaired two-tailed Student’s t test (n ≥ 100 from three independent trials). Error bars represent SD. (E) Serial dilutions of different GFP-nic96 kap mutants on YPD plates. (F) Maximum projections of GFP-nic96 yeast strains grown to at 32°C. Scale bar, 5 µm. (G) Percentage of cells grown at 32°C with GFP-Nic96 focus; *, P ≥ 0.05 using unpaired two-tailed Student’s t test compared with wild type (n ≥ 100 cells from three independent trials); **, P ≤ 0.05 when additionally compared with nup116ΔGLFG. Error bars represent SD. (H) Serial dilutions of the listed strains on YPD plates. (I) Quantification of EM images to determine physical interactions between the NE and vacuoles in cells (within 20 nm of one another) grown at 36°C. Error bars represent SD. *, P ≤ 0.001 compared with wild type using a two-tailed Student’s t test (n = 24). These values are likely lower than those derived from fluorescence microscopy, because we did not necessarily quantify the regions with maximal contacts in each cell and quantified only what was observed in the specific plane these images were captured in.

