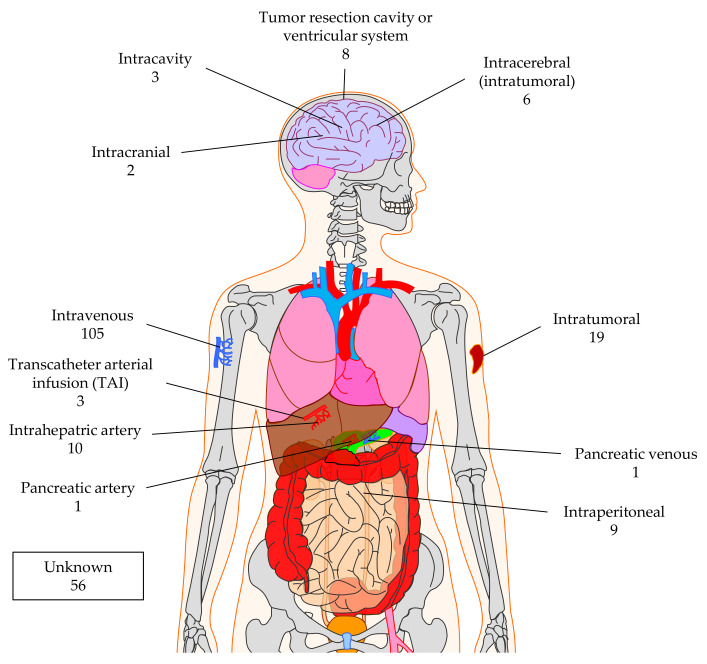
Figure 9.
Schematic overview of the injection sites used to apply CAR-T cells against solid tumors. The numbers indicate the number of clinical trials using this injection site. Data was extracted from clinicaltrials.gov. The Motifolio Scientific Illustration Toolkit was used for the generation of this figure.

