Figure 2.
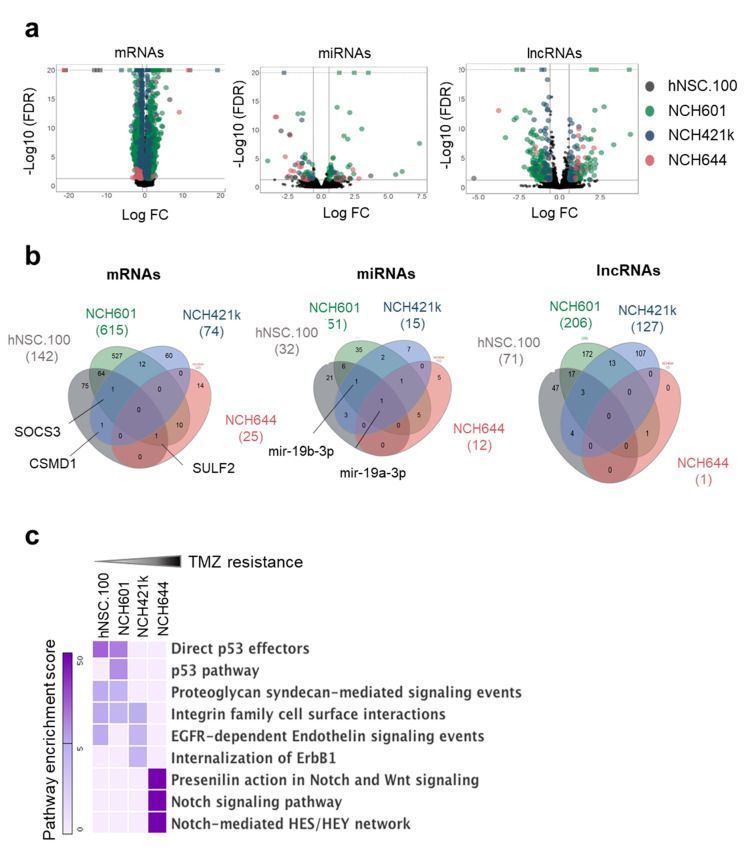
Genome-wide transcriptional changes induced by TMZ in GSCs. (a) Volcano plots representing the TMZ-regulated RNA subclasses in three GSCs (NCH601, NCH421k, NCH644) and one control neural stem cell line (hNSC.100): mRNAs (left panel), microRNAs (middle panel), lncRNAs (right panel). Each differentially expressed gene is represented by a dot and cell lines are indicated by different colors. Cut-offs for differential expression: FDR < 0.05 and absolute log FC > 2 for mRNAs, and FDR < 0.05 and absolute log FC > 1.5 for non-coding RNAs. Genes not satisfying these criteria are in black. For visualization purposes, the vertical axis has a limit of -log10 (FDR) = 20. (b) Venn diagrams showing the intersection of RNAs regulated by TMZ from the four cell lines. (c) Heat map representing the enrichment score of the top three pathways associated with mRNAs regulated by TMZ in each cell line.

