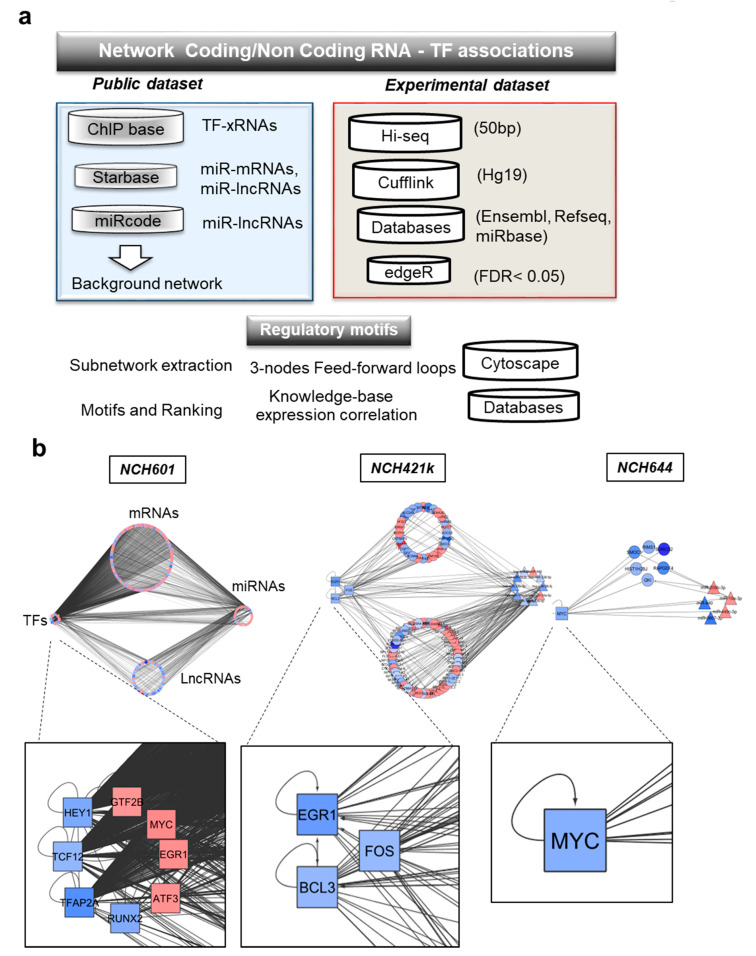
Figure 4.
Systems approaches used for the generation of the RNA interactome and gene regulatory networks induced by TMZ in GBM. (a) Overview of the analysis pipeline, (b) gene regulatory networks representing the molecular associations between different RNA biotypes in different GSCs: mRNAs, miRNAs, lncRNAs, and transcription factors (TFs). Up- and downregulated RNAs are shown in red and blue, respectively. Different node shapes distinguish RNA biotypes: TF: square, miRNA: triangle, mRNA: circle, lncRNA: hexagon.

