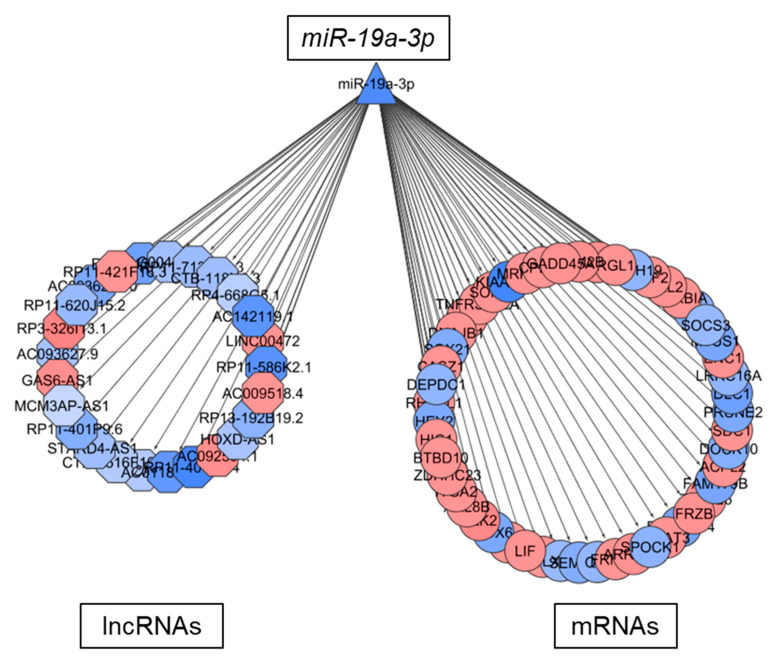
Figure 6.
Putative ceRNA function of lncRNAs regulated by TMZ. Gene regulatory network representing the molecular associations between miR-19a-3p and mRNAs or lncRNAs in NCH601. Up- and downregulated RNAs are shown in red and blue, respectively. Different node shapes distinguish RNA families; TF: square, miRNA: triangle, mRNA: circle, lncRNA: hexagon.

