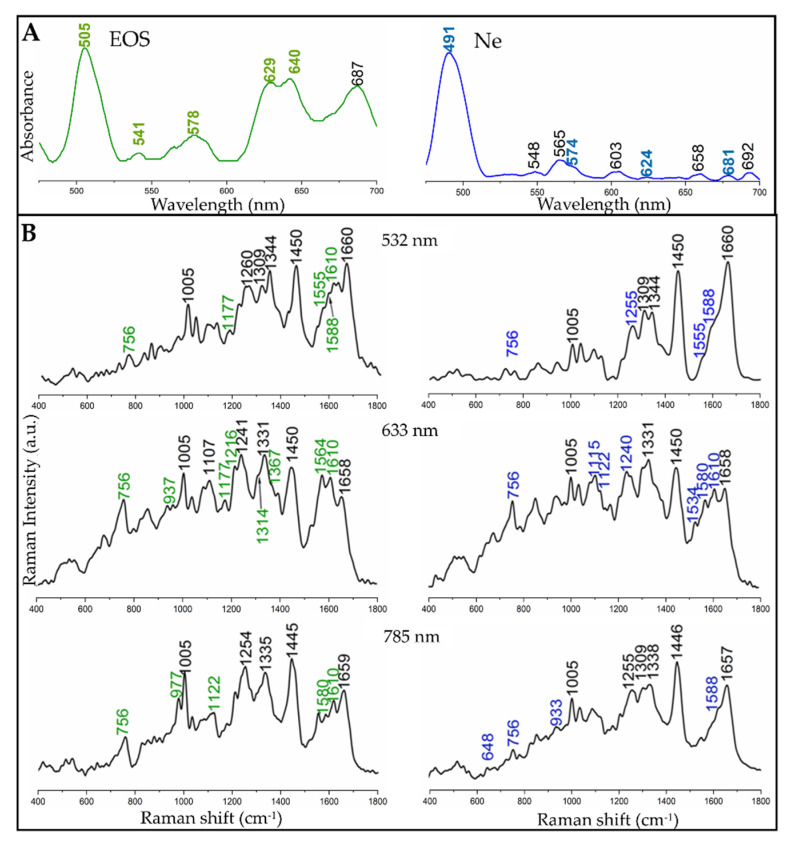
Figure 2.
Spectral characteristics of eosinophil (EOS, left) and neutrophil (Ne, right) cells. (A) UV−Vis electronic spectra of suspended EOS and Ne cells (strong Soret bands at ca. 410–440 nm are not shown to improve visibility of absorption bands in the region of the used excitation lines). (B) Averaged single point Raman spectra of EOS and Ne cells (n = 10), acquired with excitation wavelengths at 532, 633, and 785 nm. Bands labelled in green and blue correspond to the bands observed in the spectra of EPO and MPO, respectively, (Figure 1). In grey there is presented the spectra of PBS.

