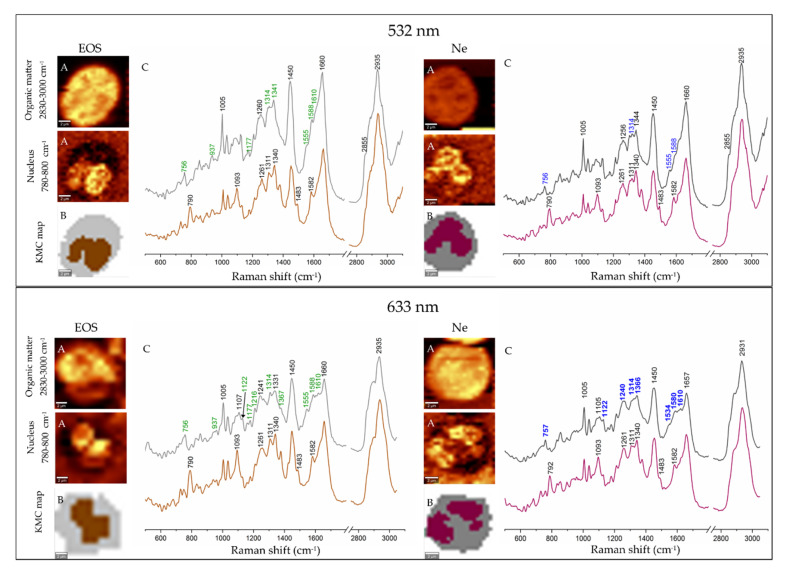
Figure 3.
Raman imaging of eosinophil (EOS, left panel) and neutrophil (Ne, right panel) with laser excitations at 532 and 633 nm. (A) Raman distribution images of organic matter and nuclei. (B) False-color k-means cluster analysis (KMC) maps with the distribution of cytoplasm (grey) and nuclei (brown and purple); (C) Mean Raman spectra extracted from KMC analysis (colors of spectra correspond to the colors of KMC classes). Bands labelled in green and blue are assigned to EPO and MPO, respectively. Scale bar: 2 μm.

