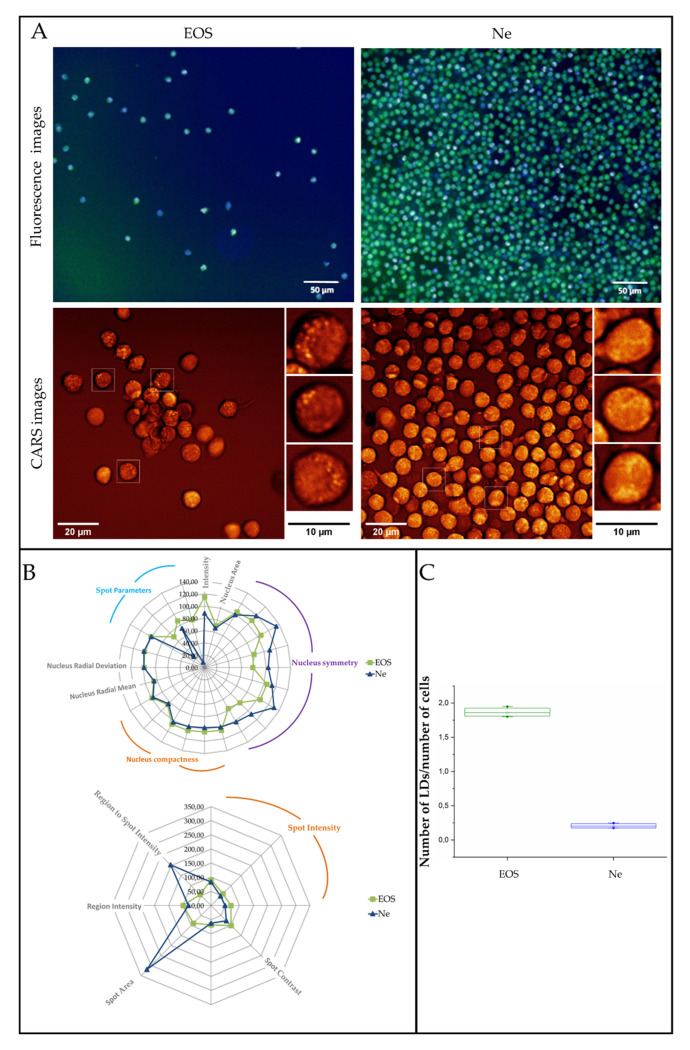
Figure 4.
(A) Fluorescence (Hoechst 33,342—blue, nuclei and BODIPY 493/503—green, LBs) and coherent anti-Stokes Raman scattering images (CARS) of human eosinophils and neutrophils. (B) Multi-parametric morphological analysis of nuclei (upper) and LBs (lower) in fluorescence images. (C) A graph showing the number of LBs per cell, calculated from fluorescence images. Values are given as mean ± standard deviation and are shown in box plots: mean (horizontal line), SE (box), minimal and maximal values (whiskers).

