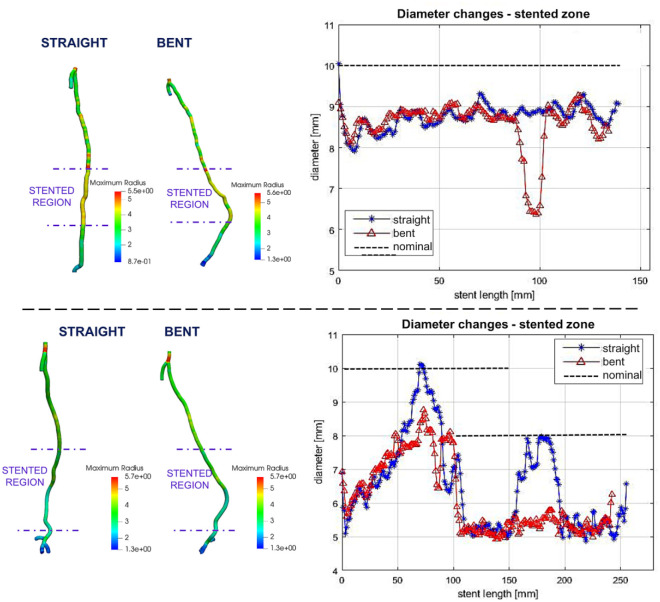
Figure 4.
Diameter reduction in the stent-graft segment due to limb flexion in 2 patients. Left: Contour plots depicting changes in artery diameter along the length of the segmented femoropopliteal arteries. Right: Change in femoropopliteal diameter along the length of the stent-graft zone in straight (blue) and bent (red) positions. Nominal stent-graft diameters are depicted with black dashed lines; 2 partially overlapping endografts are shown for the second patient.

