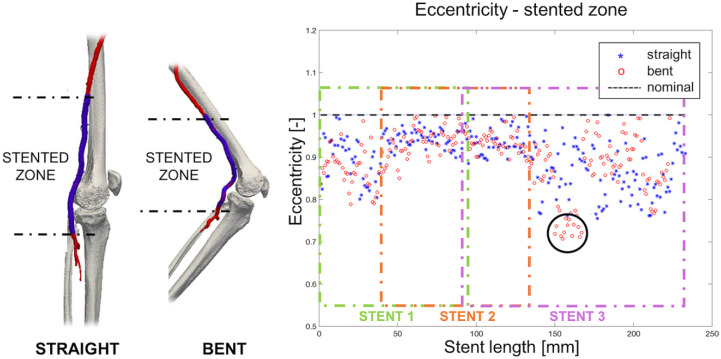
Figure 5.
On the left, 3-dimensional reconstruction of bones and the femoropopliteal segment (red) in both straight- and bent-limb configurations from a representative patient. The stent-graft is highlighted in blue. On the right, the graph demonstrates the change in eccentricity along the length of the stent-graft segment in straight and bent positions. The black dashed line denotes eccentricity of an ideal circular section. The black circle highlights the zone where eccentricity reduction was observed during limb flexion. Colored boxes refer to different stents.

