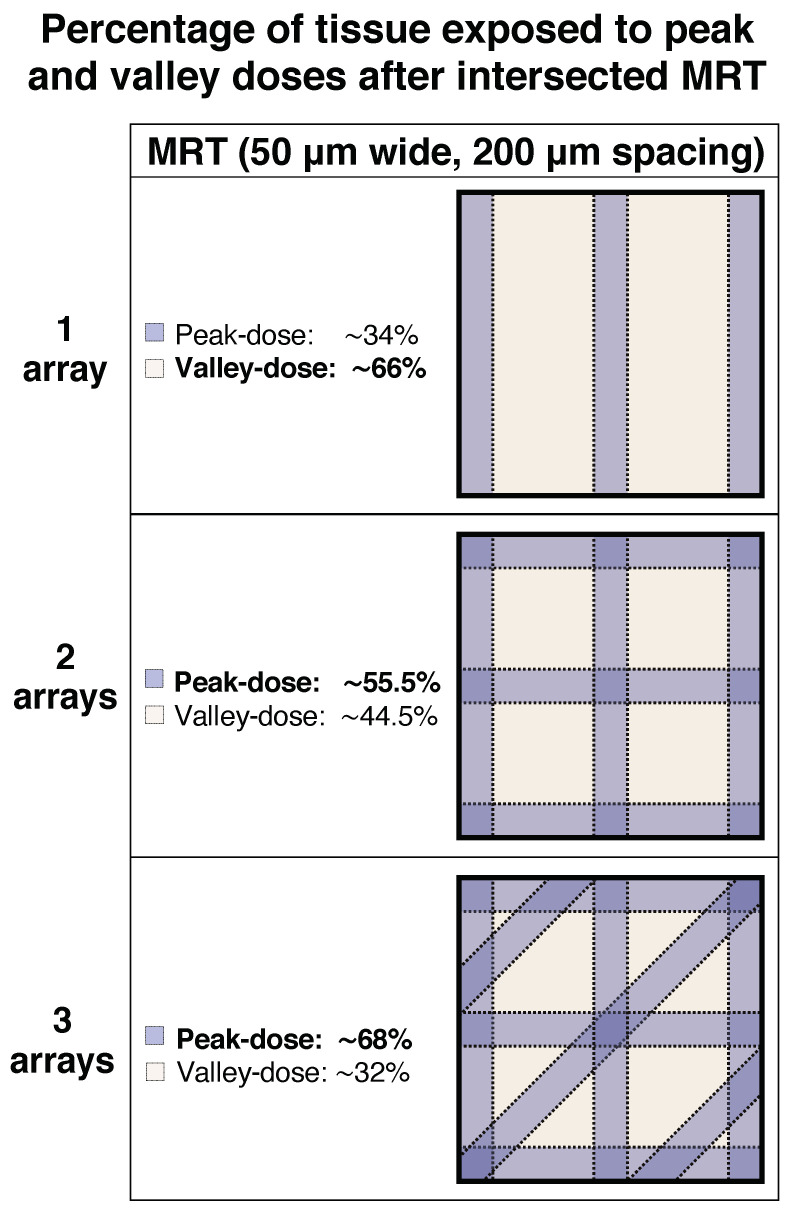
Figure 5.
Intersecting the MRT arrays changes the total percentage of tissue exposed to peak and valley doses. This figure is a two-dimensional schematic representation of the geometrical distribution of three intersecting MRT arrays (microbeams 50 μm in width, 200 μm spacing) in a squared piece of tissue. As the number of intersecting arrays increases from one to three, the percentage of tissue exposed to peak doses increases in an inversely proportional matter to the percentage of tissue that remains exposed to valley doses.

