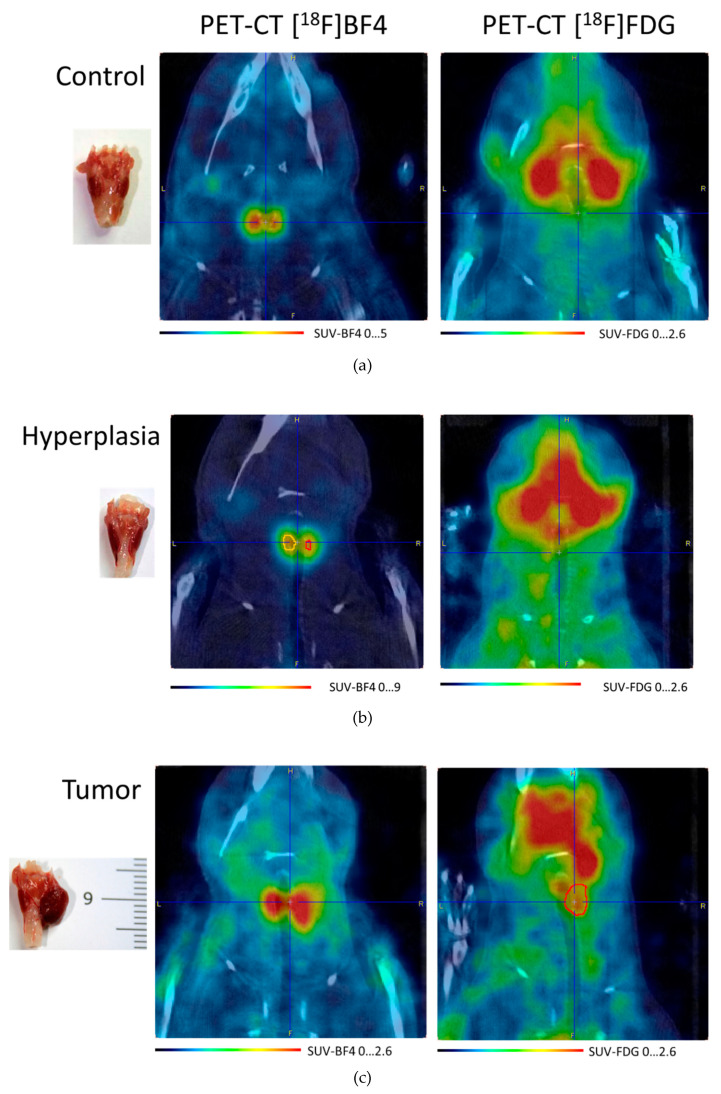
Figure 2.
Dorsal view of the thyroid gland. PET-CT in vivo images obtained using [18F]NaBF4 ([18F]BF4) and [18F]fluorodeoxyglucose ([18F]FDG). Blue cross centered in the thyroid area. (a) Control animal. (b) Hyperplastic thyroid gland. The volumes of yellow and red show the thyroid gland, which appears to be the same size in the PET image, with a resolution of 2.3 mm. Pay attention to the uptake of the FDG in the annular muscle, the front to the blue cross. (c) Tumor in the thyroid gland. Red: volume of interest (VOI) shows the outline of the tumor for the SUVmax 1.7… 2.4. [18F]BF4) and [18F]FDG images were taken within eight days for each animal. The point of high metabolism of the anterior-internal FDG close to the blue cross is the annular muscle that opens the larynx. On the left, tumor scale in mm. PET/CT DICOM image files are available as Supplementary Material S1 and as reference [15].

