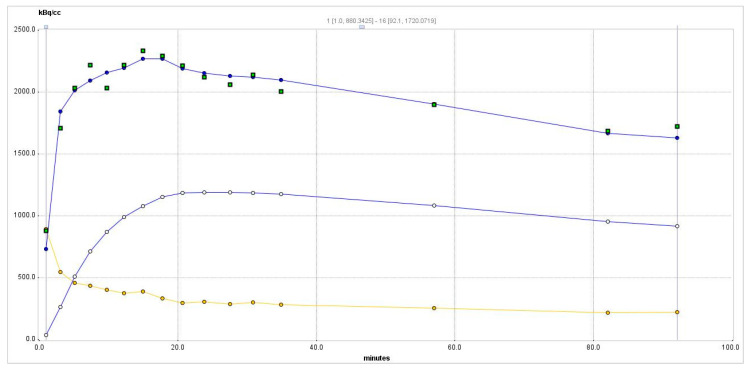
Figure 3.
Time-activity curve of the PET radiotracer in the hyperplastic thyroid. Squares—experimental data point from the right thyroid. The blue curve passing among these points is a two-tissue compartment model curve from Equation (1). Yellow circles show whole-blood data derived from the image; the yellow curve is the whole-blood curve. Empty circles show the specific binding concentration C2.

