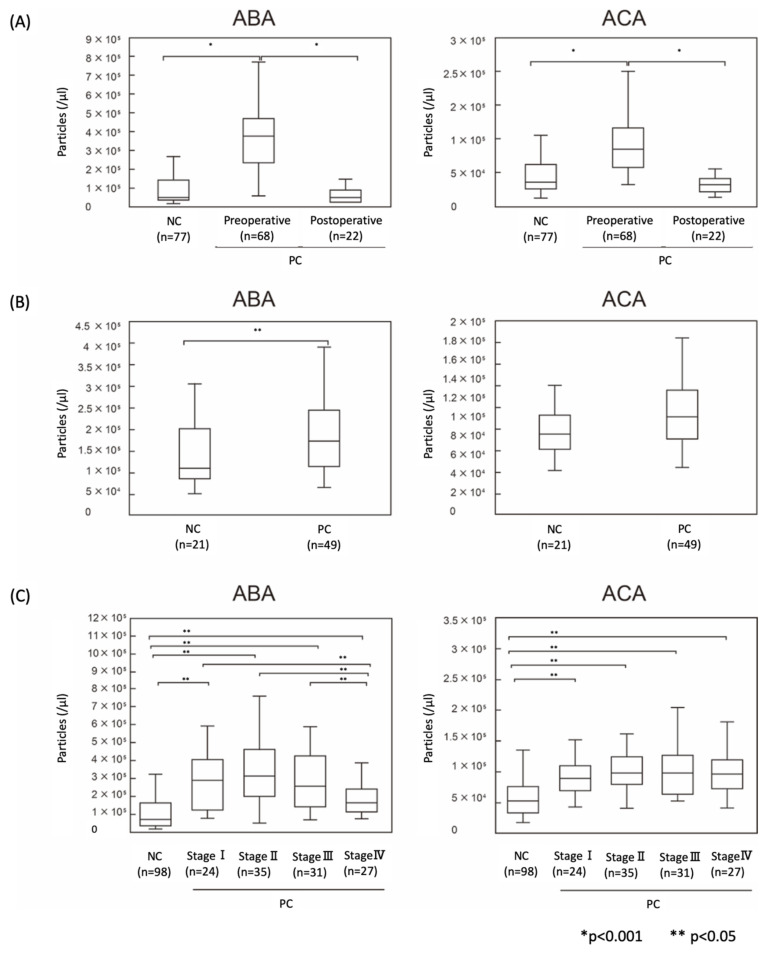
Figure 5.
Quantification of ABA- and ACA-positive EVs in PC sera. Patient sera were analyzed using ABA- or ACA-coated discs and anti-CD9 Ab-conjugated beads with ExoCounter. (A) Quantification of ABA- and ACA-positive EVs from sera of preoperative and postoperative PC patients and NC (cohort 1). (B) Quantification using PC and NC sera obtained from cohort 2. (C) Comparison of ABA- and ACA-positive EVs from PC stage I–IV and NC sera in cohorts 1 and 2. Box plot indicates the 25th to 75th percentile. The medians of the samples are represented as the bars. p values were calculated using the Mann–Whitney U-test. * p < 0.05, ** p < 0.01.

