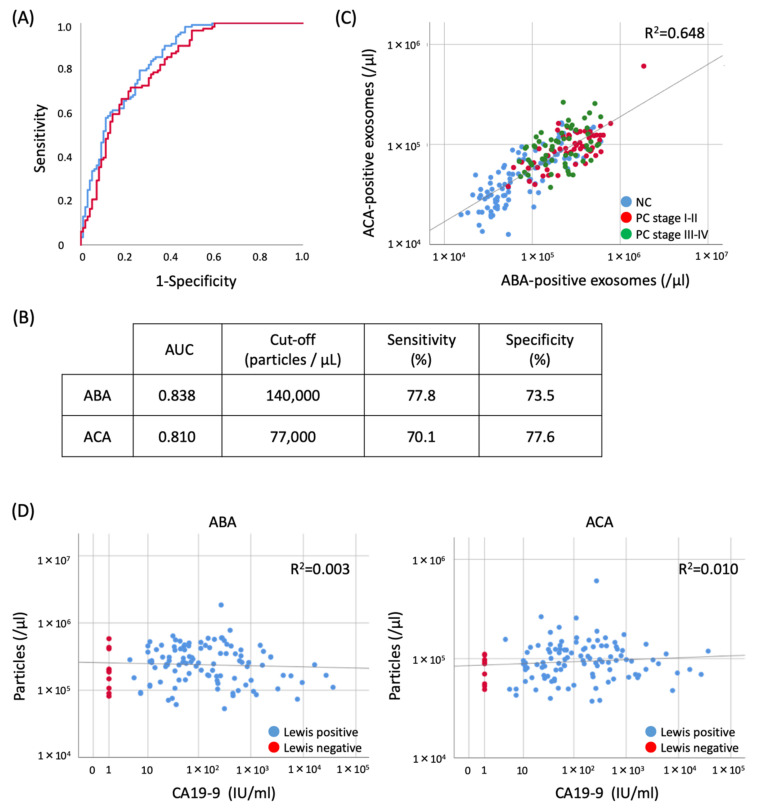
Figure 6.
Characteristics of ABA- or ACA-positive EVs in PC sera. (A) The ROC curve obtained for ABA-positive EVs (blue line) and ACA-positive EVs (red line) differentiates PC patients from NC. (B) The AUC, a cut-off value, sensitivity, and specificity are described, respectively. (C) Scatter plots of ABA- and ACA-positive EVs in sera. Blue, red, and green dots indicate NC, PC stage I-II (early stage), and III-IV (advanced stage), respectively. (D) Scatter plots of the ABA- or ACA-positive EVs and CA19-9 in PC sera. Red and blue dots indicate Lewis antigen negative and positive patients, respectively.

