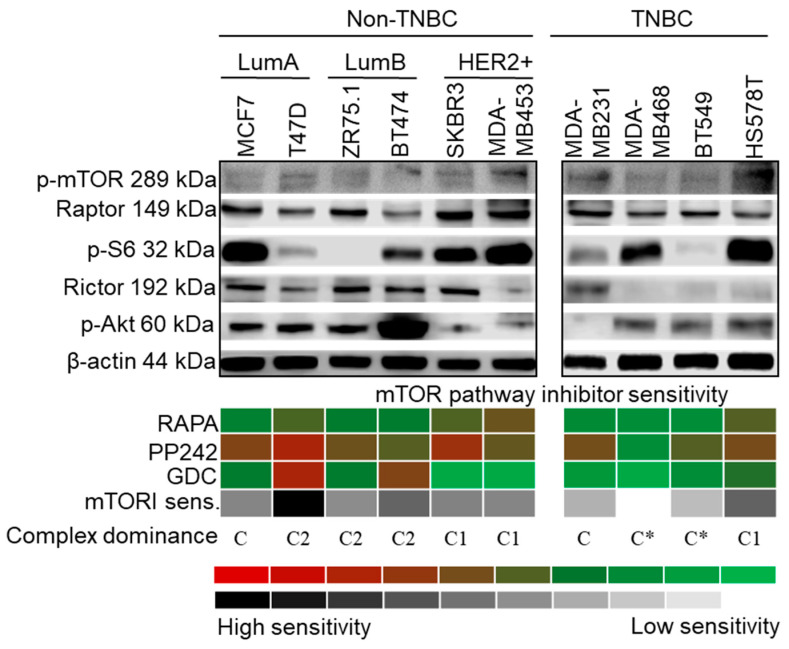
Figure 2.
Characteristics of mTOR activity in breast cancer cell lines. Representative Western blots show high mTORC1 and/or C2 activity protein expression patterns (C1—p-mTOR, Raptor and p-S6; C2—p-mTOR, Rictor and p-(Ser473)-Akt (p-Akt)), in a cell line-dependent, subtype-independent manner. In vitro sensitivity to rapamycin (RAPA—50 ng/mL), PP242 (1 µM) and GDC (1 µM) (inhibitors of C1, C1/C2 and Akt, respectively) treatment (72 h) is presented with a colour scheme showing the inhibitory effects, based on the averages of Alamar Blue and sulforhodamine B (SRB) test results: green/white (0%, resistant cells) to red/black (~90–100%, highly sensitive cells). Sensitivity to inhibitors of the mTOR pathway was calculated by adding the intensity scores of the three inhibitors. For determining the distribution of active mTOR complexes—referred as complex dominance—protein expression and inhibitor sensitivity in individual cell lines were taken into account. (C1: C1 complex dominant; C2: C2 complex dominant; C: no complex activity dominance; C*: mTOR inhibitor-resistant phenotype) (loading control: β-actin; triple negative breast cancer—TNBC; luminal A—LumA; luminal B—LumB; HER2+ subtypes).

