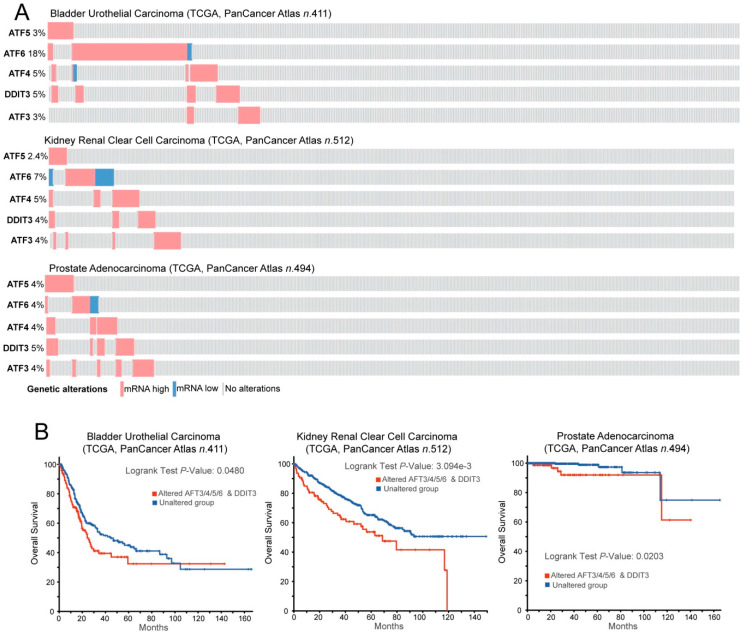
Figure 3.
ATF factors in cancer. (A) Oncoprint of mRNA expression variations for the indicated TFs. Data were obtained from the TCGA database and include RNAseq data from patients, as indicated. The heatmap shows the alterations in the expression levels and was generated through cBioPortal (http://www.cbioportal.org). mRNA expression z-scores are relative to diploid samples (RNA Seq V2 RSEM). (B) Kaplan–Meier survival analysis related to the alterations in the mRNA levels of the ATF network. All cases were analyzed and clustered into two groups according to ATF3/4/5/6 and DDIT3/CHOP alterations in the expression levels, as illustrated in (A). Data were generated through cBioPortal (http://www.cbioportal.org).

