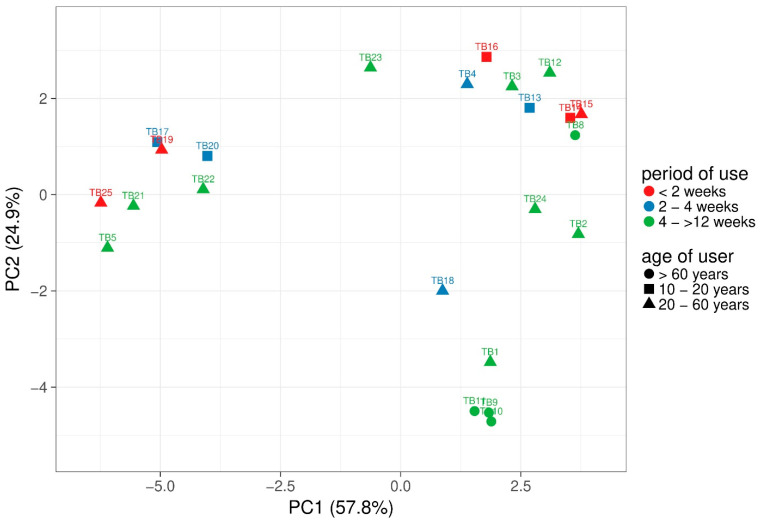
Figure 2.
Principal component analysis (PCA) of toothbrush samples (n = 23) based on weighted UniFrac distance analysis. Unit variance scaling was applied to rows and NIPALS (Nonlinear Iterative Partial Least Squares) PCA was used to calculate principal components. X- and Y-axis show principal component 1 and principal component 2 that explain 57.8% and 24.9% of the total variance, respectively. Period of use: <2 weeks (n = 6), 2–4 weeks (n = 6), 4–>12 weeks (n = 11)) and user age: (10–20 years (n = 5), 20–60 years (n = 14), >60 years (n = 4)).

