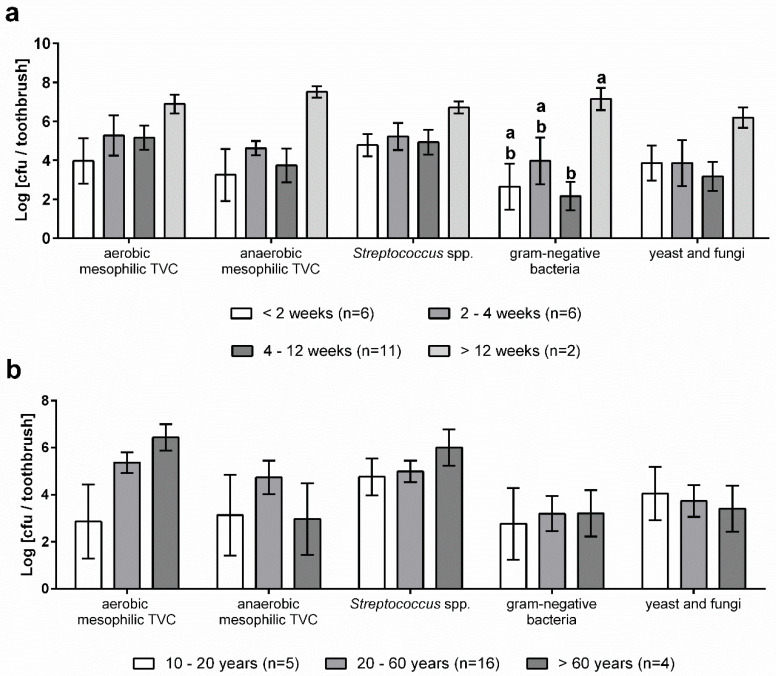
Figure 4.
Microbial count of toothbrushes grouped by period of use (a) and user age (b) on different culture media. Columns show the mean and standard error of mean (n = 25). Different letters indicate significant differences at p ≤ 0.05 (multiple t-test) between groups. Where no letters are shown, no significant differences were detected.

